
In this section, we will read about some widely used classification algorithms. These algorithms predict the probability that the data that follows will fall into one of the predetermined categories.
2.4.1 K-Nearest Algorithm
The k-nearest neighbour algorithm is a supervised learning algorithm in which the output value of data is known but how to get the output is not known. For example, if we have several groups of labeled samples and all items available are homogeneous, then to find which group an item with unknown label belongs, we will find similarities between the item (at hand) and with items in each group. Finally, we will conclude that the item belongs to the group to which it is most similar. The k-nn algorithm works in exactly the same way.
The k nearest neighbours’ algorithm stores all available cases and classifies new cases by a majority vote of its k neighbours. The algorithm segregates unlabelled data values into well-defined groups.
Technically speaking, k-nn is a non-parametric supervised learning algorithm which classifies data into a particular category with the help of training set. Here, the word non-parametric means that it makes assumptions on the underlying data distribution. Non-parametric methods do not have fixed numbers of parameters in the model. The parameters in the model grows with the training data set.
In the k-nn algorithm, the value for a new instance (x) is predicted by searching the training set for the k most similar cases (neighbours) and summarizing the output values for those k cases. In other words, this is the mode (or most common) value.
2.4.1.1 Choosing an Appropriate K Value
The most important thing to do in the knn algorithm is to determine an appropriate value of k, that is, the number of nearest neighbours. A large value of k reduces the noisy data. But if we have more data points in one group then we may ignore the smaller patterns which may have useful insights.
k-nn uses all of the data for training while classifying a new data point or instance.
2.4.1.2 Example of Knn Algorithm
Suppose we have n number of students rated on two parameters – Academic Score and EC Score on a scale of 1 to 10 as given in Table 2.1.
TABLE 2.1 Academic Score and EC Score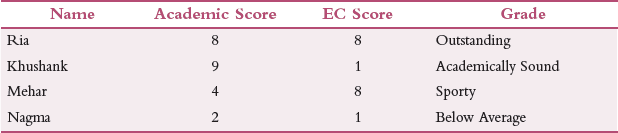
Then, academic score is an indication of how well the student performs academically and EC score is the score obtained by the student in extra-curricular activities.
Now, if we have a new student to categorize then we will calculate distance between ‘New Student’ and its nearest neighbours (‘Outstanding’, ‘Sporty’, ‘Academically Sound’ and ‘Below Average’) using the Euclidean distance formula as shown in Fig. 2.15.
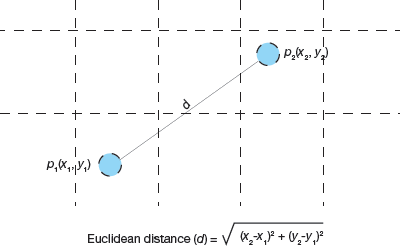
FIGURE 2.15 Euclidean distance between two points
Assuming that co-ordinates of the New Student are (8,2), we calculate the distance between Below Average (2,1) and New Student as:
dist(Below Average, New Student) = 6.08
Similarly, calculate the distance of New Student from each of its nearest neighbours as shown in Table 2.2.
TABLE 2.2 Scores including New Data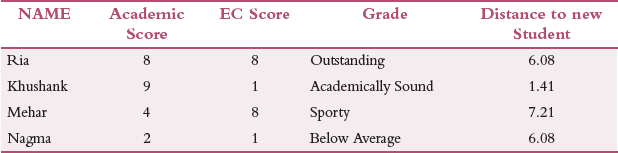
We see that the distance between New Student and Academically Sound is the least so the New Student belongs to the group of academically sound students.
k-NN algorithm can also be used for prediction. It is extensively used in pharmaceutical industry to detect the growth of oncogenic (cancer) cells or presence of disease.
Another Example
Consider Fig. 2.16. If we have to two classes – class A denoted by red stars and class B indicated by blue triangles, then to classify a new green square object the value of k plays an important role. If k=3, then according to Fig. 2.16, the 3 nearest neighbours belong to class B. So, the new object is placed in class B. but if we take k = 7, then the new object will be a member of class A. If we take k = 1, then the new object will belong to class B. Hence, value of k greatly influences the classification.
The K-nearest neighbour can be used for regression when dependent variable is continuous. In this case, the predicted value is the average of the values of its k nearest neighbours.
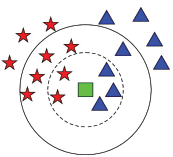
FIGURE 2.16 Finding nearest neighbor for the new data point (green). The new data will either belong to the group represented by red star or to the one represented as blue triangle
2.4.1.3 Pros and Cons of Knn Algorithm
Pros
- The kNN algorithm is a very simple and effective algorithm.
- Users can easily implement the algorithm which has made the algorithm quite popular with data professionals.
- The algorithm is highly unbiased in nature and does not make any prior assumption of the underlying data.
- The kNN algorithm works well with multi-class algorithms
- The algorithm can be applied to both classification and regression.
KNN is a non-parametric learning algorithm, which means that it doesn’t assume anything about the underlying data.
Cons
- Usually, simple things are not very powerful; same is the case with kNN algorithm.
- Although the algorithm trains the model really fast, the prediction time is high
- Many a time, useful insights may get ignored.
- The algorithm is sensitive to the scale of data so data must first be standardized
- The performance of the algorithm deteriorated when there are multiple independent variables
- The algorithm requires more memory and is computationally expensive
- It does not work well if the target variable is skewed
- The accuracy of the algorithm depends on k value. For any given problem, a small value of k will lead to a large variance in predictions. And setting k to a large value may lead to a large model bias.
Handling categorical variables in KNN
If you have categorical variables, then create k dummy variables out of that categorical variable. For example, if a categorical variable named “Designation” has 3 unique levels / categories then create 3 dummy variables. Each dummy variable has 1 against its designation and 0 otherwise.
Leave a Reply