
To this point, we have discussed predicting p–V–T properties for pure components of real gases. How should you treat mixtures of real gases? The actual critical points of binary mixtures are not linear combinations of the properties of the two components as shown in Figure 7.9 for combinations of CO2 and SO2. Too many dimensions are involved to draw pictures for three or more components.
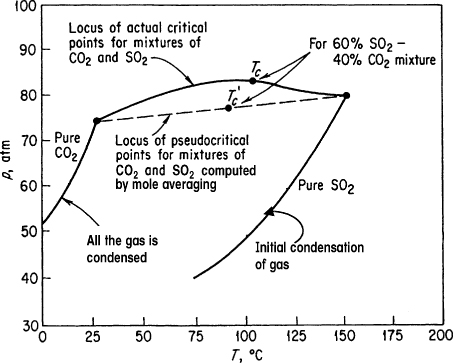
Figure 7.9. Critical and pseudocritical points for mixtures of CO2 and SO2
One way you can make reasonable predictions for z and ![]() for engineering purposes is to use Kay’s method3 and the compressibility charts. In Kay’s method, pseudocritical values for mixtures of gases are calculated on the assumption that each component in the mixture contributes to the pseudocritical value in the same proportion as the mole fraction of that component in the gas. Thus, the pseudocritical values are computed as mole averages as follows:
for engineering purposes is to use Kay’s method3 and the compressibility charts. In Kay’s method, pseudocritical values for mixtures of gases are calculated on the assumption that each component in the mixture contributes to the pseudocritical value in the same proportion as the mole fraction of that component in the gas. Thus, the pseudocritical values are computed as mole averages as follows:


where yi is the mole fraction, ![]() is the pseudocritical pressure, and
is the pseudocritical pressure, and ![]() is the pseudocritical temperature. You can see that these are linearly weighted mole average pseudocritical properties. Look at Figure 7.9, which compares the true critical values of a gaseous mixture of CO2 and SO2 with the respective pseudocritical values. The respective pseudoreduced variables are
is the pseudocritical temperature. You can see that these are linearly weighted mole average pseudocritical properties. Look at Figure 7.9, which compares the true critical values of a gaseous mixture of CO2 and SO2 with the respective pseudocritical values. The respective pseudoreduced variables are

Kay’s method is known as a two-parameter rule since only pc and Tc for each component are involved in the calculation of z. If a third parameter such as zc, or the Pitzer acentric factor, or ![]() , is included in the determination of the compressibility factor, you would have a three-parameter rule. Other pseudocritical methods with additional parameters provide better accuracy in predicting p–V–T properties than Kay’s method, but Kay’s method can suffice for our work, and it is easy to use.
, is included in the determination of the compressibility factor, you would have a three-parameter rule. Other pseudocritical methods with additional parameters provide better accuracy in predicting p–V–T properties than Kay’s method, but Kay’s method can suffice for our work, and it is easy to use.
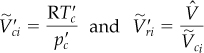
In instances in which the temperature or pressure of a gas mixture is unknown, to avoid a trial-and-error solution using the generalized compressibility charts, you can compute the pseudocritical ideal volume and a pseudoreduced ideal volume ![]() thus
thus
![]() can be used in lieu of
can be used in lieu of ![]() or
or ![]() in the compressibility charts.
in the compressibility charts.
An enormous literature exists describing proposals for mixing rules for equations of state, that is, rules to weight the coefficients or the predictions of each pure component so that the weighted values can be used with the same equations of state as are used for a pure component. Refer to the references at the end of this chapter, or look on the Internet for examples.
Even if there is only one possible unified theory it is just a set of rules and equations.
Stephen Hawking
Example 7.9. Calculation of p-V-T Properties for a Real Gas Mixture
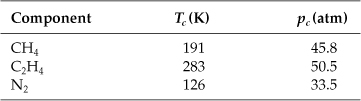
A gaseous mixture has the following composition (in mole percent):
Methane, CH4 20
Ethylene, C2H4 30
Nitrogen, N2 50
at 90 atm pressure and 100°C. Compare the volume per mole as computed by the methods of (a) the ideal gas law and (b) the pseudoreduced technique (Kay’s method). What other types of averaging might you use?
Solution
Basis: 1 g mol of gas mixture
Additional data needed are
The units used are fixed by the units of R. Let R be ![]() .
.
a. Ideal gas law:

b. According to Kay’s method, you first calculate the pseudocritical values for the mixture:

T ′c = TcAyA + TcByB + TcCyC = (191)(0.2) + (283)(0.3) + (126)(0.5) = 186 K
Then you calculate the pseudoreduced values for the mixture:

With the aid of these two parameters you can find from Figure 7.8b that zT′r = 1.91 and thus z = 0.95. Then

Two of the many possible ways of averaging are to use an equation of state with mole-averaged coefficients, or use the mole-averaged predictions of ![]() obtained from the individual equation of state. If you decided to use Equation (7.9) to calculate z for the mixture, how might you average z0, z1, and w?
obtained from the individual equation of state. If you decided to use Equation (7.9) to calculate z for the mixture, how might you average z0, z1, and w?
Leave a Reply