
You can conveniently display the properties of compounds via phase diagrams. A pure substance can exist in many phases simultaneously of which, as you know, solid, liquid, and gas are the most common. Phase diagrams enable you to view the properties of two or more phases as functions of temperature, pressure, specific volume, concentration, and other variables.
We discuss phase diagrams in terms of water because presumably you are familiar with the three phases of water, namely, ice, water, and water vapor (steam), but the discussion applies to all other pure substances. The terms vapor and gas are used very loosely in practice. A gas that exists below its critical temperature is usually called a vapor because it can condense. We reserve the word vapor to describe a gas below its critical point in a process in which the phase change is of primary interest, while we use gas and noncondensable gas to describe, respectively, a gas above the critical point and a gas in a process at conditions under which it cannot condense.
Phase diagrams are based on equilibrium conditions. That is, for phase equilibrium, it is assumed that each phase remains invariant (i.e., constant quantity under constant conditions). On a molecular level, when two or more phases are present, there will always be molecules that move from one phase to another, but under phase equilibrium, the net flux is zero. For example, for a liquid and a vapor in phase equilibrium, the flux of molecules from the liquid into the vapor must be equal to the flux from the vapor to the liquid. In fact, when multiple phases exist, continuous exchange between phases occurs, even at equilibrium.
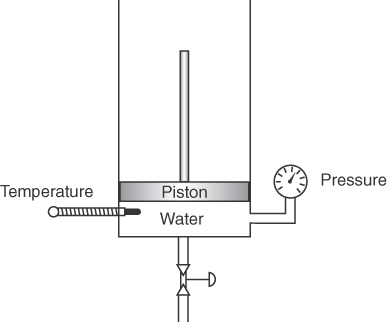
Suppose you carry out some experiments with the apparatus shown in Figure 7.1. Place a lump of ice in the chamber below the piston, and evacuate the chamber to remove all air (you want to retain only pure water in the chamber). Fix the volume of the chamber by fixing the position of the piston, and start slowly (so that the phases of water that result will be in equilibrium) heating the ice. If you plot the measured pressures as a function of temperature, you will get Figure 7.2, a phase diagram in which all of the measurements made have been fitted by a continuous smooth curve for clarity.
The initial conditions of p and T in the chamber are at point O in Figure 7.2 with the solid in equilibrium with the vapor.
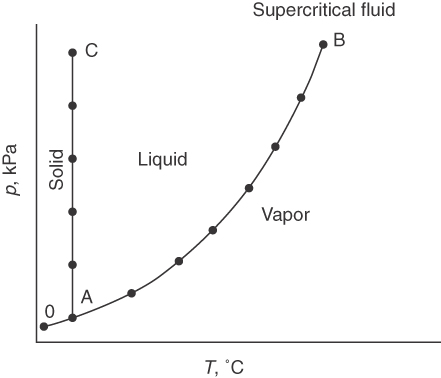
As you raise the temperature, the ice would start to melt at point A, the triple point, the one p-V^-T combination at which solid, liquid, and vapor can be in equilibrium. Further increase in the temperature causes the ice to abruptly melt before forming water vapor and the pressure to rise, which is indicated by the curve AB. B is the critical point at which vapor and liquid properties become the same.
If you had kept the temperature almost constant and raised the pressure on the ice, ice would still exist and be in equilibrium with liquid water along the line AC. The line AC is so vertical that you can use the saturated liquid properties for the properties of the compressed liquid. Ice skating is possible because the high pressure exerted by the thin blade on ice forms a liquid layer with low friction on the blade.
If the vapor and liquid of a pure component are in equilibrium, the equilibrium pressure is called the vapor pressure, which we will denote by p*. At a given temperature, there is only one pressure at which the liquid and vapor phases of a pure substance may exist in equilibrium. Either phase alone may exist, of course, over a wide range of conditions.
We next take up some terminology associated with processes that are conveniently represented on a p*-T phase chart such as Figure 7.3 (in the definitions of terms that follow, the letters in parentheses refer to the corresponding process denoted in Figure 7.3 by the same sequence of letters):
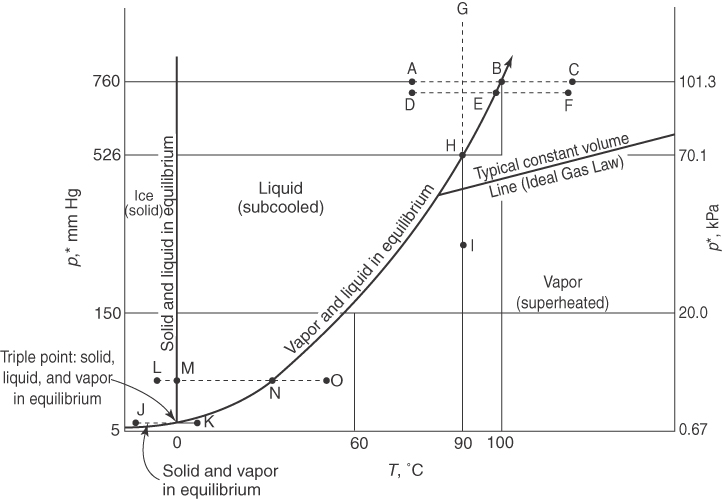
- Boiling: The change of phase from liquid to vapor (e.g., B, E, N; note that because boiling occurs at a constant temperature and pressure, the process of boiling appears as a point in a p*-T diagram).
- Bubble point: The temperature at which a liquid just starts to vaporize (N, H, and E are examples).
- Condensation: The change of phase from vapor to liquid (e.g., N, E, B; note that because condensation occurs at a constant temperature and pressure, the process of condensation appears as a point in a p-T diagram).
- Dew point: The temperature at which the vapor just begins to condense at a specified pressure, namely, temperature values on the horizontal axis read from the vapor pressure curve (N, H, and E are examples).
- Evaporation: The change of phase from liquid to vapor (e.g., D to F, A to C, or M to O).
- Freezing (solidifying): The change of phase from liquid to solid (N to L).
- Melting (fusion): The change in phase from solid to liquid (L to M; similarly to boiling, the process of melting or fusion appears as a single point in a p-T diagram).
- Melting curve: The solid-liquid equilibrium curve starting at the triple point and continuing almost vertically through M.
- Normal boiling point: The temperature at which the vapor pressure (p*) is 1 atm (101.3 kPa) (point B for water); the temperature at which a liquid will begin to boil at the standard atmospheric pressure.
- Normal melting point: The temperature at which the solid melts at 1 atm (101.3 kPa).
- Saturated liquid/saturated vapor: Values along the liquid and vapor equilibrium curve (vapor-pressure curve, e.g., N to B).
- Subcooled liquid: T and p values for the liquid between the melting curve and the vapor-pressure curve (liquid D is an example).
- Sublimation: Change in phase from solid to vapor (J to K).
- Sublimation curve: The solid-vapor equilibrium curve from J (and lower) to the triple point.
- Sublimation pressure: The pressure along the melting curve (a function of temperature).
- Supercritical region: p-T values above the critical point (not shown in Figure 7.3).
- Superheated vapor: Values of vapor at temperatures and pressure exceeding those at saturation; I is an example. The degrees of superheat are the differences in temperature between the actual T and the saturated T at the given pressure. For example, steam at 500°F and 100 psia (the saturation temperature for 100 psia is 327.8°F) has (500 − 327.8) = 172.2°F of superheat.
- Vaporization: The change of phase from liquid to vapor (for example, D to F).
In Figure 7.3, the process of evaporation (A to C) and condensation (C to A) of water at 1 atm is represented by the line ABC with the phase transformation occurring at 100°C. Suppose that you went to the top of Pikes Peak and repeated the process of evaporation and condensation in the open air. What would happen then? The process would be the same (points DEF) with the exception of the temperature and pressure at which the water would begin to boil, or condense. Since the pressure of the atmosphere at the top of Pikes Peak is lower than 101.3 kPa, the water would start to boil at a lower temperature. Some unfortunate consequences might result if you expected to kill certain types of disease-causing bacteria by boiling the water! In addition, it will take longer to cook rice at that elevation due to the lower boiling point for water at higher elevations.
To conclude, at equilibrium you can see that (a) at any given temperature water exerts its unique vapor pressure; (b) as the temperature goes up, the vapor pressure goes up, and vice versa; and (c) it makes no difference whether water vaporizes into air, into a cylinder closed by a piston, into an evacuated cylinder, or into the atmosphere; at any temperature it still exerts the same vapor pressure as long as the liquid water is in equilibrium with its vapor.
A pure compound can change phase at constant volume from a liquid to a vapor, or the reverse, via a constant temperature process as well as a constant pressure process. A process of vaporization, or condensation, at constant temperature is illustrated by the lines GHI or IHG, respectively, in Figure 7.3. Water would vaporize or condense at constant temperature as the pressure reached point H on the vapor-pressure curve. The change that occurs at H is the increase or decrease in the fraction of vapor, or liquid, respectively, at the fixed temperature. The pressure does not change until all of the vapor, or liquid, has completed the phase transition.
Now let’s go back to the experimental apparatus and collect data to prepare a p-V^ phase chart. This time you want to hold the temperature in the chamber constant and adjust the volume while measuring the pressure. Start with compressed liquid water (subcooled water) rather than ice, and raise the piston so that water eventually vaporizes. Figure 7.4 illustrates by dashed lines the measurements for two different temperatures, T1 and T2. As the pressure is reduced at constant T1, V^ increases very slightly (liquids are not very compressible) until the liquid pressure reaches p*, the vapor pressure, at point A.
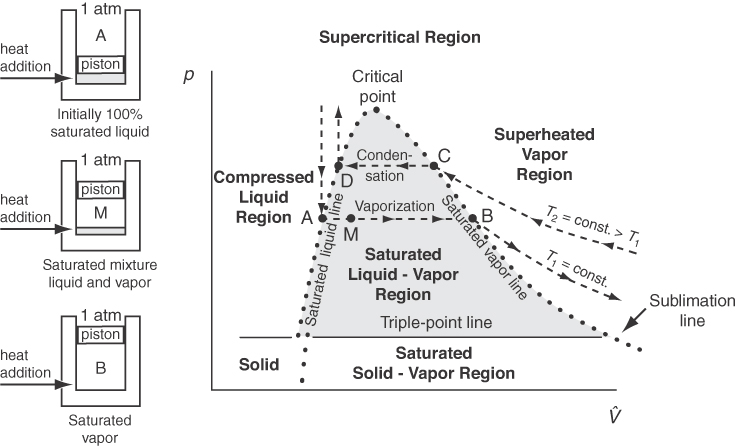
Then, as the piston still rises (i.e., as V^ increases), both the pressure and temperature remain constant until all of the liquid is vaporized by point B on the saturated vapor line. Subsequently, starting from point B, as the pressure reduces, the value of V^ can be calculated via an ideal or real gas equation. Compression at constant T2 is just a reversal of the process at T1. The dots in Figure 7.4 represent just the measurements made when saturation of liquid and vapor coexist and are deemed to form the envelope for the two-phase region that from a different angle appears in Figures 7.2 and 7.3 as the vapor-pressure curve. The two-phase region (e.g., A to B or D to C) represents the conditions under which liquid and vapor can exist at equilibrium. Note from Figure 7.4 the discontinuous change in the specific volume in going from a liquid to a solid at the triple point. In other words, water expands when it freezes, and this is why ships trapped in the polar ice can be crushed by the force of the expanding ice. By comparing Figures 7.3 and 7.4, you can see that lines AB and CD in the p-V^ phase diagram (Figure 7.4) correspond to a single point each in the p-T diagram (Figure 7.3).
Figure 7.4 involves a new term, quality, the fraction or percent of the total vapor and liquid mixture that is vapor (wet vapor). Examine Figure 7.5. You can calculate the volume of the liquid-vapor mixture at B in Figure 7.5 by adding a volume fraction of material that is saturated liquid to the volume fraction that is saturated vapor:
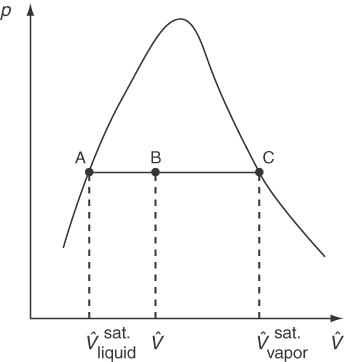
V^=(1−x)V^liquidsat.+xV^vaporsat.
(7.1)
where x is the fractional quality. Solving for x yieldsx=V^−V^liquidsat.V^vaporsat.−V^liquidsat.
That is, by examining the location of V^ in relation to V^vaporsat. and V^liquidsat., you can determine the quality.
Figures 7.3 and 7.4 can be reconciled by looking at the three-dimensional surface that illustrates the p-V^-T (see Figure 7.6).
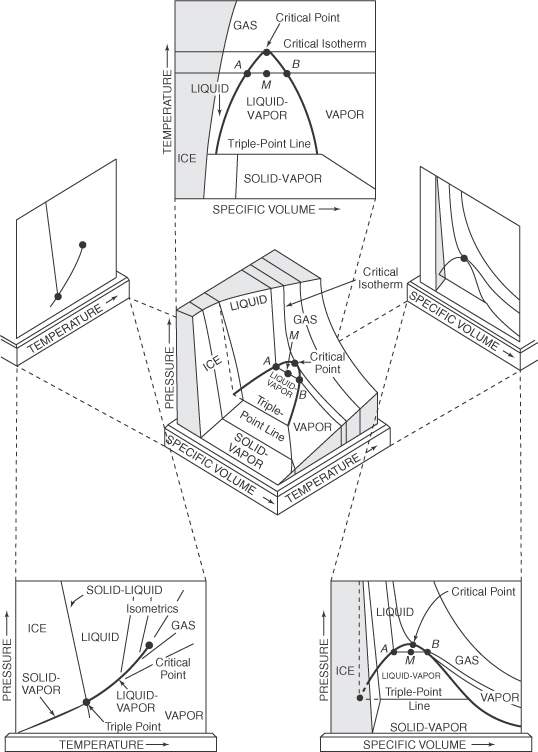
You can see that vapor pressure is the two-dimensional projection, yielding a curve, of a three-dimensional surface into the p-T plane. Note that the vapor-pressure curve in a p-T plane is actually a surface in the three-dimensional representation because a vapor and liquid at equilibrium are at the same temperature (see Figure 7.6). Figure 7.3 thus proves to be a portion of the complete region shown in Figure 7.6.
Now we consider the phase rule, which defines key relationships between the phases in a phase diagram. The phase rule pertains only to systems at equilibrium. Equilibrium means
- A state of absolute rest
- No tendency to change state
- No processes operating (physical equilibrium)
- No fluxes of energy, mass, or momentum
- No temperature, pressure, or concentration gradients
- No reactions occurring (chemical equilibrium)
Thus, phase equilibrium means that the phases present in a system are invariant as are the phase properties. By phase, we mean a part of a system that is chemically and physically uniform throughout. This definition does not necessarily imply that a phase is continuous. For example, ice cubes in water represent a system that consists of two phases. The important concept of phase for you to retain is that a gas and liquid at equilibrium can each be treated as having a uniform domain. Each ice cube is chemically and physically the same; hence, all the cubes are considered to make up one phase. The decision about whether a solid is one or more phases is not always clear.
If you mechanically mix table salt and sugar, you have a solid system, but it consists of two distinct solid phases. Small particles of one phase are intermingled with small particles of the other. Particles of sugar are not the same chemically as those of salt, even though they may appear to be the same physically. On the other hand, it should be emphasized here that most gases and liquids at equilibrium can be assumed to be uniform.
The phase rule is concerned only with the intensive properties of the system. By intensive, we mean properties that do not depend on the quantity of material present. If you think about the properties we have employed so far in this book, do you get the feeling that pressure and temperature are independent of the amount of material present? Concentration is an intensive variable, but what about volume? The total volume of a system is called an extensive variable because it does depend on how much material you have; on the other hand, the specific volume (the volume per mass) or the density (mass per volume) are intensive properties because they are not independent of the amount of material present. You should remember that the specific (per unit mass) values are intensive properties; the total quantities are extensive properties. Furthermore, the state of a system is specified by the intensive variables, not the extensive ones.
You will find Gibbs phase rule to be a useful guide in establishing how many intensive properties, such as pressure and temperature, have to be specified to definitely fix all of the remaining intensive properties and number of phases that can coexist for any physical system. The rule can be applied only to systems in equilibrium and is given by Equation (7.2), assuming that no chemical reaction occurs:F=2−P+C
(7.2)
where
F = number of degrees of freedom (i.e., the number of independent properties that have to be specified to determine all of the intensive properties of each phase of the system of interest)—not to be confused with the degrees of freedom calculated in solving material balances that can involve both intensive and extensive variables.
P = number of phases that exist in the system; a phase is a homogeneous quantity of material such as a gas, a pure liquid, a solution, or a homogeneous solid.
C = number of independent components (chemical species) in the system.
Let’s look at Figure 7.7, which shows the surface of part of Figure 7.6. Consider the vapor phase.
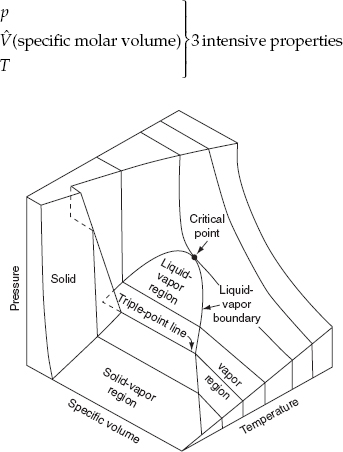
You will remember for a pure gas that we had to specify three of the four variables in the ideal gas equation pV = nRT in order to be able to determine the remaining one unknown. You might conclude that F = 3. If we apply the phase rule, for a single phase P = 1 and for a pure gas C = 1.
F = 2 − P + C = 2 − 1 + 1 = 2 variable to be specified
How can we reconcile this apparent paradox with our previous statement? Easily! Since the phase rule is concerned with intensive properties only, the following are the phase rule variables to be included in the ideal gas law:
Thus, the ideal gas law would be writtenpV^=RT
(7.3)
and in this form, you can see that when two intensive variables are specified (F = 2), the third can be calculated. Thus, in the superheated region in the steam tables, you can fix all of the properties of the water vapor by specifying two intensive variables.
An invariant system is one in which no variation of conditions is possible without one phase disappearing. In Figure 7.7, a system that is composed of ice, water, and water vapor exists at only one temperature (0.01°C) and pressure (0.611 kPa), namely, along the triple-point line (a point in a p-T diagram), and represents one of the invariant states in the water system:
F = 2 − P + C = 2 − 3 + 1 = 0
With all three phases present, none of the physical conditions of p, T, or V^ can be varied without one phase disappearing. As a corollary, if the three phases are present, the temperature, the specific volume, and so on, must always be fixed at the same values. This phenomenon is useful in calibrating thermometers and other instruments. Now let’s look at some examples of the application of the phase rule.
Example 7.1 Application of the Phase Rule
Problem Statement
Calculate the number of degrees of freedom (how many additional intensive variables must be specified to fix the system) from the phase rule for the following materials at equilibrium:
- Pure liquid benzene
- A mixture of ice and water only
- A mixture of liquid benzene, benzene vapor, and helium gas
- A mixture of salt and water designed to achieve a specific vapor pressure
What variables might be specified in each case?
Solution
- P = 1, and C = 1; hence, F = 2 − 1 + 1 = 2. The temperature and pressure might be specified in the range in which benzene remains a liquid.
- P = 2, and C = 1; hence, F = 2 − 2 + 1 = 1. Once either the temperature or the pressure is specified, the other intensive variables are fixed.
- P = 2, and C = 2; hence, F = 2 − 2 + 2 = 2. A pair from temperature, pressure, or mole fraction can be specified.
- P = 2, and C = 2; hence, F = 2 − 2 + 2 = 2. Since a particular pressure is to be achieved, you would adjust the salt concentration and the temperature of the solution.
Note that in a and b it is likely that a vapor phase would exist in practice, increasing P by 1 and reducing F by 1.
Self-Assessment Test
Questions
1. Why does dry ice sublime at room temperature and pressure?
2. List two intensive and two extensive properties.
3. Indicate whether the following statements are true or false:
- a. A phase is an agglomeration of matter having distinctly identifiable properties such as a distinct refractive index, viscosity, density, X-ray pattern, and so on.
- b. A solution containing two or more compounds constitutes a single phase.
- c. A mixture of real gases constitutes a single phase.
4. Fill in the following table for water:
| Number of Phases P | Example | Degrees of Freedom F | Number of Variables That Can Be Adjusted at Equilibrium |
|---|---|---|---|
| 1 | Steam | ||
| 2 | Steam and water | ||
| 3 | Steam, water, and ice |
Answers
1. The point representing ambient temperature and pressure falls below the liquid region, where only solid and vapor exist in equilibrium.
2. Intensive: any p, T, c, ρ, etc.; extensive: any of V, m, n, etc.
3. All true.
4. Number of phases = 1: 2 DOF; number of phases = 2: 1 DOF; number of phases = 3: 0 DOF. Note that the number of DOF is equal to the number of variables that can be adjusted at equilibrium.
Problems
1. Determine the number of degrees of freedom from the phase rule for the following systems at equilibrium:
- a. Liquid water, water vapor, and nitrogen
- b. Liquid water with dissolved acetone in equilibrium with their vapors
- c. O2(g), CO(g), CO2(g), and C(s) at high temperature
2. A tank contains 1000 kg of acetone (C3H6O), half of which is liquid and the other half of which is in the vapor phase. Acetone vapor is withdrawn slowly from the tank, and a heater in each phase maintains the temperature of each of the two phases at 50°C. Determine the pressure in the tank after 100 kg of vapor have been withdrawn.
3. Draw a p-T phase diagram for water. Label the following clearly: vapor-pressure curve, dew point curve, saturated region, superheated region, subcooled region, and triple point. Show the processes of evaporation, condensation, and sublimation by arrows.
Answers
1. a. F = 2 – 2 + 2 = 2; b. F = 2 – 2 + 2 = 2; c. F = 2 – 2 + 4 = 4
2. If equilibrium is maintained, the pressure is the vapor pressure of acetone at 50°c (i.e., 610 mm hg).
Leave a Reply