
When it comes to mobile management and control, things are in flux, and there is a lot to know. In general, mobile marketing can be a great way to learn about your potential customers and drive conversion in online and offline scenarios. Most types of digital marketing have their own unique types of measurement and control mechanisms, but then also, many companies will choose to do what they can to bring all the different channels of data together into a central dashboard. This can give you a great understanding of what is working and what is not.
Like other forms of digital marketing, it is common to use strategies like A/B and multivariate testing to determine what parts of your mobile apps or websites are resonating well with customers and driving conversions and what tweaks can be made to improve the performance. Some tools like Optimizely and Taplytics can be used for ongoing A/B testing of web content, and also again, Google offers a competitive option called Google Optimize 360 that is quick and easy to integrate.
The difficulty associated with mobile measurement and control is caused by the data limitations that are associated with privacy. This is the other side of the proverbial privacy coin. Mobile devices are inextricably tied to specific people and all the parts of their life, so the privacy protections must be more significant. Since most of the mobile landscape is covered by devices from Google and Apple, it is important to understand how they protect the privacy of their users and how that can filter down to impact the measurement of your mobile campaigns.
Apple is better known for protecting its users’ privacy than Google is. Starting with their iOS 14.5 operating system, Apple began to require app developers to state clearly what information they collect in their apps and how it is used, and Apple also requires apps to ask for permission before tracking users’ activities in third‐party apps and websites. In more recent updates, Apple has taken this further, by also showing when apps share your information with third parties, and sometimes even exactly where the data are being shared. This is part of a project that Apple calls App Tracking Transparency (ATT). It turns out that when given the choice explicitly, only 6 percent of iOS users choose to allow apps to collect and share their data, so in terms of users’ privacy protection, the effort has been successful, but for advertisers and marketers, it has been a new change.
Apple has its own trackers that it calls IDFA, which stands for ID for Advertisers. This is a long string of letters and numbers that is unique to each phone, a bit like a person’s Social Security number. If an iOS user gives an app permission to track him or her, it is this ID that is shared with websites and apps, to associate the user’s behaviors on apps and websites with the ID. It is what allows apps to do things like advertising themselves on a social network like Facebook and then track and attribute the download to a specific user, showing that the ad actually resulted in a download of the app.
Google is less known for its privacy protections, but it has also recently announced multiple avenues of protection for Android phone users. Google also has its own unique identifiers that are used for tracking in Android; these are simply called an Advertising ID. Google has said that it will limit the use of Advertising IDs for sharing user data or data associated with a specific device to other apps and websites. It has announced similar limitations in its Chrome desktop and mobile browser, limiting the use of third‐party cookies for tracking, but most of the changes have yet to be deployed. This move by Google has been mostly just announced, and it will be slower to fully launch. It is expected to finally roll out in 2023 or later.
Google calls its multiyear privacy initiative and the associated APIs the privacy sandbox. Google’s goal in moving more slowly is to preserve the mobile data that have historically been the backbone of mobile‐first business marketing programs—especially for mobile apps and games, which rely on the targeted mobile ads to drive downloads and engagement. It has mechanisms that allow different web and app properties that are owned by the same company to set up sharing across different domains and apps; it also creates a way to anonymize some data so that they can still be reportable in aggregate. It also creates topic groupings that can be associated with user groups in a more general, less invasive way, and it is trying to design a system where ad remarketing, which has historically been driven by third‐party cookies, might still work with more privacy protections and no third‐party cookies that identify specific users or devices. This all has yet to be seen though, so marketers will have to watch and wait.
Additionally, Google has launched a developer initiative called Checks, to help Android and iOS app developers make their apps more secure and privacy‐conscious. Google’s ultimate solution appears to focus more on conversion modeling and potentially AI‐data‐driven attribution with aggregation and sampling, focusing more on first‐party data and information rather than third‐party affiliations and cookies.
Mobile Marketing Analytics
All of these advancements in privacy laws are definitely going to impact the ability of marketers to track and segment user data to hone their marketing messages and tactics. Some new methods and options may come out of this change, but until we see how these things all shake out, we are basically left to rely on the first‐party data that we have now, and whatever third‐party data that are available and, hopefully, learn as much as we can from it before it is possibly more limited. This means that using traditional and mobile methods of analytics to evaluate the success and opportunity in marketing campaigns may be more crucial now than ever, while there is still some third‐party data available. Mobile analytics software is designed to do exactly this, combining first‐ and third‐party data wherever it can, recording as much information as is available about interactions with your ads, marketing campaigns, and put it all into a platform that allows you to visualize and manipulate the data to answer questions and learn about the results of your marketing efforts.
In general, most of the traditional analytics software available now includes the ability to segment out or geo‐target information about mobile interactions. Segmenting mobile and desktop campaigns is one of the simplest but most impactful ways you can view your data, especially if you can compare mobile and desktop campaigns side‐by‐side, simultaneously, without the hassle of using two different platforms. In mobile marketing there are a nearly infinite number of possible combinations of analytics software because it is difficult or almost impossible to accurately track every marketing channel with one solution. Different software is often required for tracking detailed success metrics in the different channels, and you will generally benefit from using software that is tailored to the needs of the channel. Most companies benefit from setting up a variety of channel‐specific analytics software to capture data from the different channels, and then in some cases adding a layer of software for combining and visualizing the various data streams together in one place. Here, we focus on the measurement options for the different marketing channels first, then go into the more holistic marketing views for combining data sources and channels.
SMS, Push Messaging, and Geolocation Marketing Analytics In most cases, the company that sends out your text messaging campaigns, MMS campaigns, or geolocal campaigns will be able to provide basic statistics about how and when the SMS messages are being sent out, how many people are opting in versus opting out, and in some cases, how many people are clicking on any links included in the messages. In many cases, this can be enough, especially if you are using tracking code on the links or unique landing pages to help you measure which SMS campaigns drive traffic to which pages. This is a channel where the data are clear, simple, and straightforward.
Mobile Website Analytics In general, when measuring mobile website traffic, you want to start with the end in mind. The location of the most valuable conversion or engagement events should be the nexus of your analytics setup. Often, the website will be the nexus of a campaign, so these are the most important places to have tracking. Other marketing channels, like SMS, generally send traffic to the website for conversion. Some of the long standing web analytics software that includes reporting on mobile traffic are Google Analytics, Adobe Analytics, Clicky, and Coremetrics. All of these can segment mobile and desktop web traffic so that you can understand how your website is working on mobile. Google Search Console is great for tracking the success of your website rankings in Google, but it only shows organic search traffic and not ads or sponsored campaigns, so it is not enough.
If mobile ads, email, SMS, Bluetooth, or other mobile channels are sending traffic to the website, then tracking code should be appended to all of the links included in these campaigns, so that the traffic can be correctly attributed in the analytics software or in a separate layer of data analysis. This is more accurate and can often be more informative than just looking at the website referrers (i.e., sources that sent traffic to the website). This is true unless unique landing pages are being used for each channel that are only accessible from one specific campaign, in which case tracking codes are less necessary, unless you are A/B testing any messages or calls to action in acquisition campaigns. Different tools are available for this and should be used whenever possible.
App Analytics While you can see some basic information about app downloads in the native app management platforms—Apple’s App Analytics and Google’s Play Console—it is generally not enough to help marketers perform advance analysis about the source of the download. Most mobile and app ad networks will offer some reporting on their own performance, but the level of sophistication and accuracy can sometimes be limited and may not have all the advanced tagging and modeling capabilities for more sophisticated measurement and analysis.
App analytics can be a bit more complicated to measure because there are always more steps that a user must take. To complete a conversion in the app, the user must first download, install, and open the app, which can be a significant hurdle. To get more information about the specific path and in‐app behavior of the users, and if they were brought in through paid ads, organic searches, emails, or something else, you will want to set up additional analytics. More sophisticated app analytics options can also help you group different users by their demographic and psychographic similarities.
These platforms for deeper app analysis are often referred to as mobile measurement platforms (MPPs). According to Incipia, “MMPs such as AppsFlyer or Adjust are attribution tools which record the source/date of each new app user and tag each event that user completes in the app back to the user’s origination source/date. This gives marketers a ‘source of truth’ for calculating the cohorted ROI of marketing campaigns.”
The nice thing about using Google Analytics to track your website is that it can also track app interactions, but this is not its historic specialty. Similarly, Google Search Console can also be used to track Android app rankings for deep links, but this is not what it was designed for, and more sophisticated Google platforms like Firebase and Google Analytics can give you more and better information about how the iOS and Android apps are performing. Analytics software that focuses more exclusively on apps includes Flurry, which is one of the most long standing options. There is also Firebase from Google, App Analytics by Apple, AppsFlyer, AppRadar, and Singular. Kochava is great if you are measuring deep links, and GameAnalytics is ideal if you are marketing a game app. In some cases, these app analytics solutions can be free, especially for simple integrations or small apps, but they may also have costs associated with them based on traffic volume.
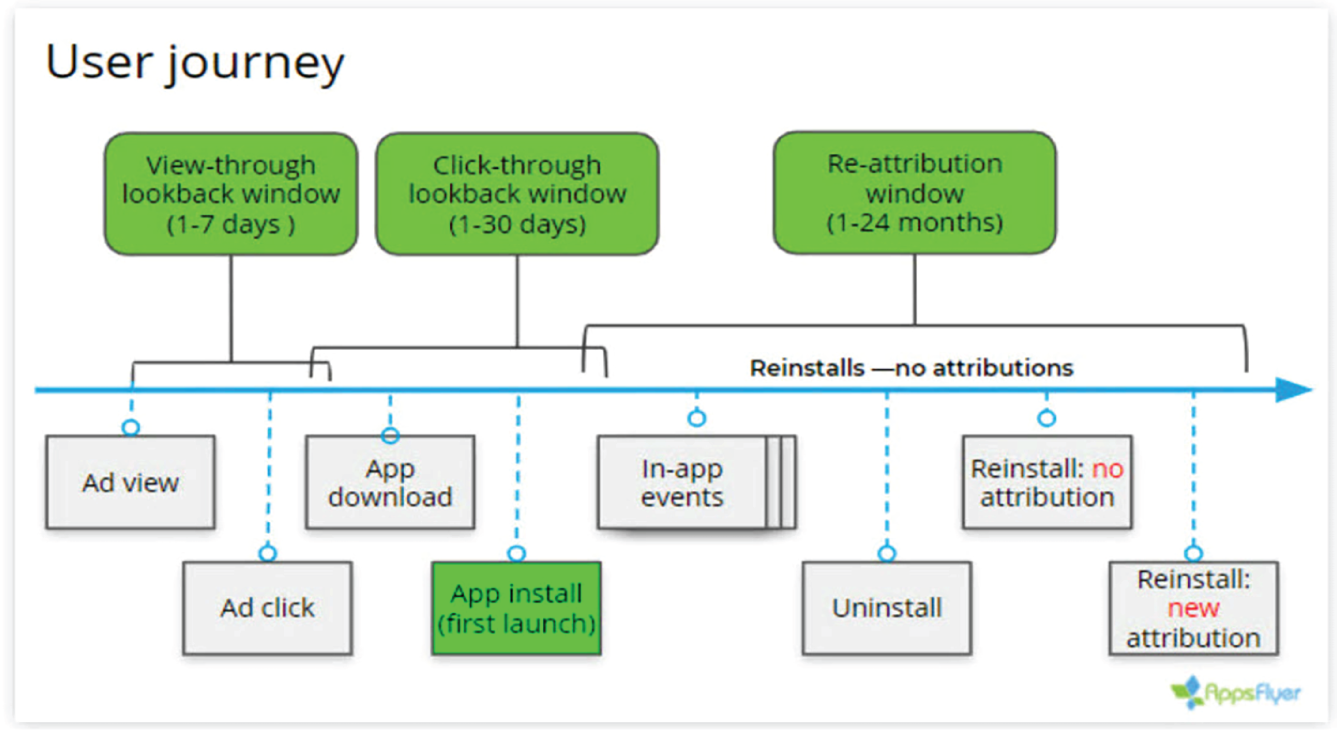
You can choose from a variety of MMP options, and their goals are all primarily to help you understand what is driving different positive and negative behaviors within the app and tie those back to aspects of the marketing and app development that you can control. Some MPP options can also help report on web interactions and interactions with deep links between the app and the website; others include features like email integrations, to help connect the app with email messaging about the app to drive more long‐term engagement and re‐engagement with the app. MPPs are great for modeling campaign attribution and to help understand which mobile marketing channels, ad networks, and campaigns are driving the best conversions. Each MMP will use a slightly different attribution model. The models are designed to help the marketing team understand and ascribe the app user activity in a meaningful way. A sample attribution model from one of the leaders in the space, AppsFlyer, is shown in Figure 8.6.
Combined Data Layers and Visualization In some cases, separate channel analytics will be enough for your mobile marketing efforts, but when many campaigns and channels are involved, you may need an additional data layer to pull everything together. When you get into the combination and visualization of your data, there are a number of good options, but the best option for you will be the one that you can easily set up and maintain to aggregate and present the data in a way that is most useful for your marketing team. Some of the most popular options that also include a free, entry‐level option are Google Data Studio, Power BI by Microsoft, and Tableau. There are also some less‐known options, like SAS and KNIME, which can also be quite useful. The learning curve on these types of data visualization software can be a bit steep. Consider contracting with an expert or at least someone who is familiar with the chosen platform to ensure that the setup is stable and the calculations and visualizations are accurate. If this is your single source of truth for evaluating your mobile marketing efforts, you need to get it right.
Interpreting Your Analytics
As you are looking at your analytics, either in a combined visualization or in channel‐specific platforms, you should approach the interpretation of the data carefully. The first thing to know is that your numbers will rarely match exactly across different platforms. This can be related to a number of factors caused by the analytics measurement technology, time zones, methodology, setup, and sometimes a normal margin of error or chance. You might not be able to consider the numbers in your analytics software to be an absolute truth, but you should expect them to be proportionally and directionally accurate. It is often good to have at least two types of analytics solutions in play at once because they can be used as a backup for each other. If ever the two systems show major differences, especially in relation to direction or proportion, it is a good indicator of a larger problem.
If you are working with large‐scale data, it can be important to segment mobile data by country and device. Different countries have different types of mobile behavior that is common or effective as a means of marketing or communication, and the same can be true of different mobile devices, operating systems, or even mobile carrier networks. These differences are generally caused by the local infrastructure, the cost, and availability of fast mobile data connections, and of course, by the cost and availability of high‐end mobile devices. To illustrate this point, the following sidebar looks at an example.
How Mobile Internet Traffic Affects Analytics
Even though the mobile Internet penetration rate in the United States is about 83 percent, it’s not the country with the highest share of mobile Internet traffic worldwide. Nigeria is! Facts like this mean that a mobile campaign in Nigeria could look very different than a campaign in the United States because almost all of the Internet traffic in Nigeria will be from mobile devices, whereas in the United States, it is more likely to be somewhat split between mobile and desktop.
The apparent discrepancy between the United States and Nigerian mobile traffic comes from the historical lack of digital infrastructure in Nigeria. The United States had a well‐established high‐speed Internet infrastructure with high user‐penetration on the desktop before mobile devices were as widespread. Conversely, in Nigeria, infrastructure for wired Internet was not well‐established, and thus, penetration for desktop computers was not high. This made it possible for mobile phones to achieve dominance very quickly. Mobile data networks are a faster and easier infrastructure to build, and mobile phones have a lower cost and, thus, a lower barrier to entry for users.
In 2021, only 47.28 percent of all U.S. Internet traffic was from mobile devices. Even though mobile penetration in Nigeria is only at 42.12 percent, a full 82.73 percent of all web traffic in that country is being generated by mobile devices. When you are working on large‐scale, international mobile marketing campaigns, information like this can be vital to understanding your own analytics. (FYI: India is just behind Nigeria, at 76.65 percent of all Internet activity coming from mobile devices. This data juxtaposition illustrates a theme that is especially common in mobile marketing statistics, and that is the importance of context for understanding and interpreting the implications of data, statistics, and your own analytics.)
Leave a Reply