
A good source of information on the state of climate in the year 2011 is the report published by the U.S. National Climatic Data Center (NCDC), which summarizes global and regional climate conditions and places them in the context of historical records (Blunden and Arndt, 2012). The parameters examined are global temperature and various gases found in the atmosphere.
Global temperature
Based on the National Oceanic and Atmospheric Administration and the U.S. NCDC records, the global temperature has been rising gradually at a rate between 0.71 and 0.77 °C per century since 1901 and between 0.14 and 0.17 °C per decade since 1971. Data show that 2011 was the ninth warmest year since records began in 1979; 0.13 °C above the 1981–2010 average whereas the upward trend for 1979–2011 was 0.12 °C per decade (Blunden and Arndt, 2012). Unusually high temperatures affected most land areas during 2011 with the most prominent effect taking place in Russia, while unusually low temperatures were observed in parts of Australia, north-western United States, and central and south-eastern Asia. Averaged globally, the 2011 land surface temperature was, according to the institution performing the analysis, ranged between 0.20 and 0.29 °C above the 1981–2010 average, ranking from 5th to 10th warmest on record, depending on the choice of data set.
Despite two La Niña episodes (the first strong and the second weaker), global average sea surface temperatures remained above average throughout the year, ranking as either 11th or 12th warmest on record. The global sea surface temperature in 2011 was between 0.02 and 0.09 °C above the 1981–2010 average depending on the choice of data set. Annual mean sea surface temperatures were above average across the Atlantic, Indian, and western Pacific Oceans, and below average across the eastern and equatorial Pacific Ocean, southern Atlantic Ocean, and some regions of the Southern Oceans (Blunden and Arndt, 2012).
The majority of the top 10 warmest years on record have occurred in the past decade. The global temperature from 1850 until 2006 is shown in Figure 1.2, together with the 5-year average values. As can be seen there is an upward trend that is more serious from the 1970s onward.
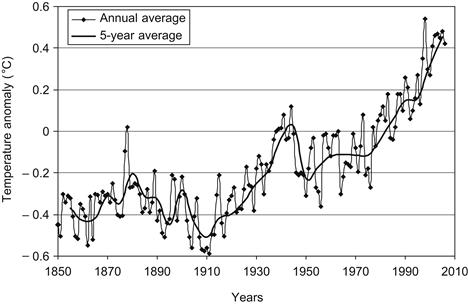
FIGURE 1.2 Global temperature since 1850.
Carbon dioxide
Carbon dioxide emitted from natural and anthropogenic (i.e., fossil fuel combustion) sources is partitioned into three reservoirs: atmosphere, oceans, and the terrestrial biosphere. The result of increased fossil fuel combustion has been that atmospheric CO2 has increased from about 280 ppm (parts per million by dry air mole fraction) at the start of the industrial revolution to about 392.9 ppm in December 2012 (see Figure 1.3). Carbon dioxide in fact has increased by 2.10 ppm since 2010 and exceeded 390 ppm for the first time since instrumental records began. Roughly half of the emitted CO2 remains in the atmosphere and the remainder goes into the other two sinks: oceans and the land biosphere (which includes plants and soil carbon).
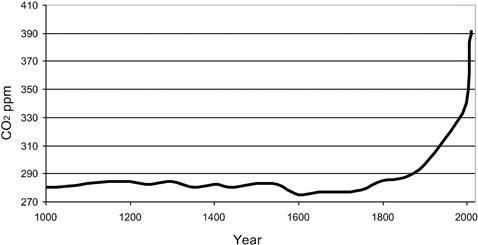
FIGURE 1.3 CO2 levels in the past 1000 years.
In 2010, anthropogenic carbon emissions to the atmosphere have increased globally to more than 9.1 ± 0.5 Pg/a (piga, P = 1015). Most of this increase resulted from a 10% increase in emissions from China, the world’s largest fossil fuel CO2 emitter. During the 1990s, net uptake by the oceans was estimated at 1.7 ± 0.5 Pg/a, and by the land biosphere at 1.4 ± 0.7 Pg/a. The gross atmosphere–ocean and atmosphere–terrestrial biosphere (i.e., photosynthesis and respiration) fluxes are on the order of 100 Pg/a. Inter-annual variations in the atmospheric increase of CO2 are not attributed to variations in fossil fuel emissions but rather to small changes in these net fluxes. Most attempts to explain the interannual variability of the atmospheric CO2 increase have focused on short-term climate fluctuations (e.g. the El Niño/Southern Oscillation and post-mountain Pinatubo cooling), but the mechanisms, especially the role of the terrestrial biosphere, are poorly understood. To date, about 5% of conventional fossil fuels have been combusted. If combustion is stopped today, it is estimated that after a few hundred years, 15% of the total carbon emitted would remain in the atmosphere, and the remainder would be in the oceans.
In 2011, the globally averaged atmospheric CO2 mole fraction was 390.4 ppm, just more than a 2.1 ± 0.09 ppm increase from 2010. This was slightly larger than the average increase from 2000 to 2010 of 1.96 ± 0.36 ppm/a. The record CO2 concentration in 2012 (392.92 ppm) continues a trend toward increased atmospheric CO2 since before the industrial era values of around 280 ppm. This continues the steady upward trend in this abundant and long-lasting GHG. Since 1900, atmospheric CO2 has increased by 94 ppm (132%), with an average annual increase of 4.55 ppm since 2000.
Methane
The contribution of methane (CH4) to anthropogenic radiative forcing, including direct (≈70%) and indirect (≈30%) effects, is about 0.7 W/m2, or roughly half that of CO2. Also, changes in the load of CH4 feed back into atmospheric chemistry, affecting the concentrations of hydroxyl (OH) and ozone (O3). The increase in CH4 since the pre-industrial era is responsible for about half of the estimated increase in background tropospheric O3 during that time. It should be noted that changes in OH concentration affect the lifetimes of other GHGs such as hydrochlorofluorocarbons (HCFCs) and hydrofluorocarbons (HFCs). Methane has a global warming potential (GWP) of 25; this means that, integrated over a 100-year timescale, the radiative forcing from a given pulse of CH4 emissions is estimated to be 25 times greater than a pulse of the same mass of CO2.
In 2011, CH4 increased by about 5 ± 2 ppb (parts per billion, 109, by dry air mole fraction), primarily due to increases in the Northern Hemisphere. The globally averaged methane (CH4) concentration in 2011 was 1803 ppb.
Stratospheric ozone over Antarctica in October 2012 reached a value of 139 Dobson units (DU) and the world average is about 300 DU. A DU is the most basic measure used in ozone research. The unit is named after G. M. B. Dobson, one of the first scientists to investigate atmospheric ozone. He designed the Dobson spectrometer, which is the standard instrument used to measure ozone from the ground. The Dobson spectrometer measures the intensity of solar UV radiation at four wavelengths, two of which are absorbed by ozone and two of which are not. One Dobson unit is defined to be 0.01 mm thickness at STP (standard temperature and pressure = 0 °C and 1 atmosphere pressure). For example, when in an area all the ozone in a column is compressed to STP and spread out evenly over the area and forms a slab of 3 mm thick, then the ozone layer over that area is 300 DU.
Carbon monoxide
Unlike CO2 and CH4, carbon monoxide (CO) does not strongly absorb terrestrial infrared radiation but affects climate through its chemistry. The chemistry of CO affects OH (which influences the lifetimes of CH4 and HFCs) and tropospheric O3 (which is by itself a GHG); so emissions of CO can be considered equivalent to emissions of CH4. Current emissions of CO may contribute more to radiative forcing over decade timescales than emissions of anthropogenic nitrous oxide.
Because the lifetime of CO is relatively short (a few months), the anomaly of increased levels of CO in the atmosphere quickly disappeared and CO quickly returned to pre-1997 levels. Carbon monoxide levels in 2011 were comparable with those found in the early 2000s. The globally averaged CO mole fraction in 2011 was about 80.5 ppb, slightly less than the 2010 value. Since 1991, little trend in globally averaged CO has been observed.
Nitrous oxide and sulfur hexafluoride
Atmospheric nitrous oxide (N2O) and sulfur hexafluoride (SF6) are present in lower concentrations than CO2, but the radiative forcing of each is far greater. Nitrous oxide is the third strongest GHG, while each SF6 molecule is 23,900 times more effective as an infrared absorber than one CO2 molecule and has an atmospheric lifetime of between 500 and 3200 years.
The concentration of both species has grown at a linear rate, N2O at 0.76 ppb/a (0.25% per year) since 1978 and SF6 at a rate of 0.22 ppt (parts per trillion, 1012, by dry air mole fraction) per year (∼5%/a) since 1996. The concentration of 324.3 ppb N2O in 2011 has added a radiative forcing of around 0.17 W/m2 over the pre-industrial N2O concentration of around 270 ppb. The 2011 value represents an increase of 1.1 ppb over the 2010 value and is higher than the average growth rate of 0.76 ppb/a shown above. Atmospheric N2O is also a major source of stratospheric nitric oxide (NO), a compound that helps to catalytically destroy stratospheric O3. The atmospheric concentration of SF6 has grown due to its use as an electrical insulator for power transmission throughout the world. Its global mean concentration was 7.31 ppt at the end of 2011, an increase of 0.28 ppt over the 2010 value. While total radiative forcing of SF6 from pre-industrial times to the present is relatively small, its long atmospheric lifetime, high atmospheric growth rate, and high GWP are a concern for the future.
Halocarbons
Concern over stratospheric ozone depletion has restricted or eliminated production of many halocarbons. The phase-out of human-produced halocarbons was the result of the 1987 Montreal Protocol on Substances that Deplete the Ozone Layer. As a result of these efforts, mixing ratios of many ozone-depleting gases have been declining at the earth’s surface in recent years; this decline continued in 2011. Reports from many laboratories around the world that perform measurements of halocarbons show that tropospheric mixing ratios of CFC-12, the longest lived and most abundant human-made ozone-depleting gas in the atmosphere, peaked within the past few years. These measurements also show that mixing ratios of some halogenated gases continue to increase globally. The most rapid increases are in HCFCs and HFCs, which are chemicals commonly used as replacements for CFCs, halons, and other ozone-depleting gases. Although HCFCs contain chlorine (Cl) and deplete O3 with a reduced efficiency compared with CFCs, HFCs do not participate in O3 destroying reactions.
Changes in the direct radiative influence of long-lived halocarbons can be estimated from observed changes in atmospheric mixing ratios with knowledge of trace-gas radiative efficiencies. Such an analysis suggests that the direct radiative forcing of these gases was still increasing in 2011, though at a much slower rate than observed from 1970 to 1990.
Sea level
The average global rate of sea level change computed over the years 1993–2011 is 3.2 ± 0.4 mm/a. Relative to the long-term trend, global sea level dropped noticeably in mid-2010 and reached a local minimum in 2011. The drop has been linked to the strong La Niña conditions that have prevailed throughout 2010–2011. Global sea level increased sharply during the second half of 2011. The global value for 2011 is 50 mm above the 1995 value. The largest positive anomalies were in the equatorial Pacific off South America. Annual sea levels were generally high in the tropical Indian Ocean, with the exception of the strong negative anomaly in the eastern Indian Ocean. Sea level deviations in the Atlantic Ocean showed bands of relatively high sea level in the South Atlantic just north of the equator, and in the sub-polar North Atlantic.
Leave a Reply