A circuit that contains a pure resistance R Ω connected in series with a pure capacitor of capacitance C Farad is known as R–C series circuit.
An R–C series circuit and its phasor diagram is shown in Figures 7.21 and 7.22, respectively. To draw the phasor diagram, current I (rms value) is taken as the reference vector. Voltage drop in resistance VR (=IR) is taken in phase with current vector, whereas voltage drop in capacitive reactance VC (=IXC) is taken 90° behind the current vector (since current leads the voltage by 90° in pure capacitive circuit). The vector sum of these two voltage drops is equal to the applied voltage V (rms value).
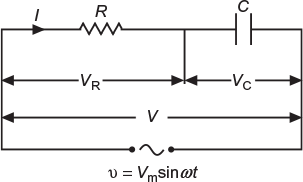
Fig. 7.21 Circuit containing resistance and capacitance in series
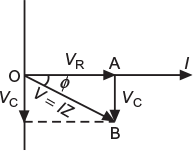
Fig. 7.22 Phasor diagram
Now,
VR = IR and VC = IXC (where XC = 1/2 π fC)
In right−angled triangle OAB

or
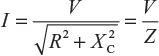
where ![]() is the total opposition offered to the flow of AC by an R–C series circuit and is called impedance of the circuit. It is measured in ohm.
is the total opposition offered to the flow of AC by an R–C series circuit and is called impedance of the circuit. It is measured in ohm.
7.11.1 Phase Angle
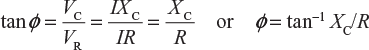
From the phasor diagram, it is clear that current in this circuit leads the applied voltage by an angle ɸ called phase angle.
From the phasor diagram shown in Figure 7.22,
7.11.2 Power
If the alternating voltage applied across the circuit is given by the equation:
v = Vm sin ω t (7.13)
Then,
i = Im sin (ω t + ɸ) (7.14)
∴ Instantaneous power,
p = vi = Vm sin ω t Im sin (ω t + ɸ) ![]()

Average power consumed in the circuit over a complete cycle,

or
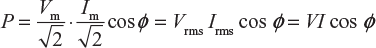
where cos ɸ is called power factor of the circuit.
From phasor diagram,
![]() same as in R–L serious circuit
same as in R–L serious circuit
Alternatively, power
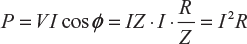
This shows that power is actually consumed in resistance only; capacitor does not consume any power.
7.11.3 Power Curve
The phasor diagram and wave diagram for voltage and current are shown in Figure 7.23(a) and 7.23(b), respectively, where applied voltage (v = Vmsin ω t) is taken as reference quantity. The power curve for R–C circuit is also shown in 7.23 (b). The points on the power curve are obtained from the product of the corresponding instantaneous values of voltage and current. It is clear that power is negative between angle (180° − ɸ ) and 180° and between (360° − ɸ ) and 360°. During rest of the cycle, the power is positive. Since the area under the positive loops is greater than that under the negative loops, the net power over a complete cycle is positive. Hence, a definite quantity of power is utilised or consumed by this circuit.
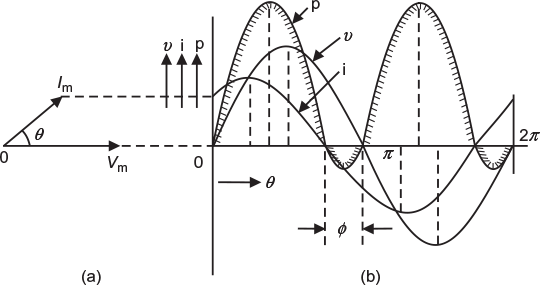
Fig. 7.23 (a) Phasor diagram (b) Wave diagram for voltage, current and power
7.11.4 Impedance Triangle
When each side of the simplified phasor diagram shown in Figure 7.24 is divided by a common factor I, we get another right−angled triangle (shown in Fig. 7.25) known as impedance triangle.
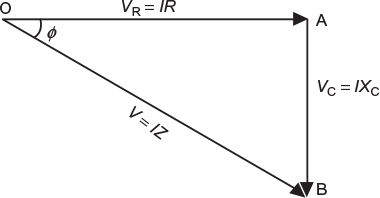
Fig. 7.24 Phasor diagram for R−C series circuit
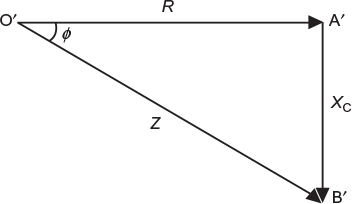
Fig. 7.25 Impedance triangle
Example 7.12
A resistance of 15 Ω and capacitor of 150 µF capacitance are connected in series across a 230 V, 50 Hz supply. Calculate (i) impedance of the circuit, (ii) current, (iii) power factor and phase angle, and (iv) power consumed in the circuit.
Solution:
The circuit is shown in Figure 7.26.
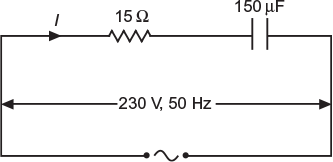
Fig. 7.26 Circuit as per data
where XC = 1/2 π ɸ C = 1/2 π × 50 × 150 × 10−6
= 21.22 Ω;
R = 15 Ω
- ∴
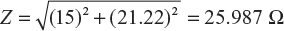 = 25.987 Ω
 - Current,
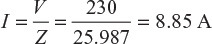
- Power factor,
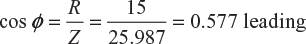 Phase angle, ɸ = cos−1 0.577 = 54.75°
 - Power, P = VIcos ɸ = 230 × 8.85 × 0.577 = 1,174.9 W
Example 7.13
A voltage of 125 V at 50 Hz is applied across a non−inductive resistor connected in series with a condenser. The current in the circuit is 2.2 A. The power loss in the resistor is 96.8 W and that in the condenser is negligible. Calculate the resistance and the capacitance.
Solution:
Applied voltage, V = 125 V; supply frequency, f = 50 Hz
Current in the circuit, I = 2.2 A; power loss in the resistor, P = 96.8 W
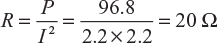
Power loss in resistor, P = I2R
∴Circuit resistance,
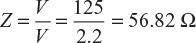
Circuit impedance,
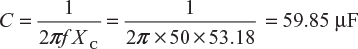
Capacitive reactance,

Capacitance of capacitor,
Example 7.14
A 120 V, 60 W lamp is to be operated on 220 V, 50 Hz supply mains. For the lamp to operate in correct voltage, calculate the value of (i) non−inductive resistance and (ii) pure inductance
(U.P.T.U. 2005–06)
Solution:
Lamp’s rating: 120 V, 60 W
Supply voltage, VS = 220 V and Frequency, ɸ = 50 Hz
Resistance of the lamp,
Operating current,
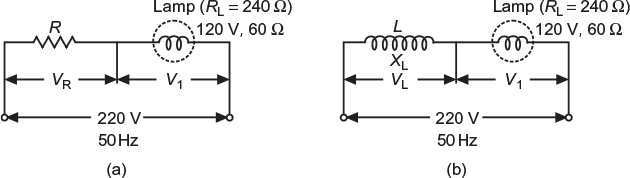
Fig. 7.27 (a) Circuit as per data (b) Circuit as per data
- For operating the lamp using non−inductive resistance, as shown in Figure 7.27(a). Let the value of resistance be R Ω.∴ I (R + RL) = Vor
 or R = 440 − RL = 440 − 240 = 200 Ω
 - For operating the lamp using pure inductance as shown in Figure 7.27(b). Let the value of inductance be L heavy and XL = 2 πfL,∴IZ = V or
 or
or RL2 + XL2 = (440)2 or XL2 = 4402 − 2402or
 or2 π f L = 368.78 or
Leave a Reply