
A car gear box can be thought of as a system with an input shaft and an output shaft (Figure 18.l(a)). We supply a rotation to the input shaft and the system then provides a rotation of the output shaft with the rotational speed of the output shaft being related in some way to the rotational speed of the input shaft. Likewise, we can think of an amplifier as a system to which we can supply an input signal and from which we can obtain an output signal which is related in some way to the input signal (Figure 18.1(b)). Thus, we can think of a system as being like a closed box in which the workings of the system are enclosed and to which we can apply an input, or inputs, and obtain an output, or outputs, with the output being related to the input.
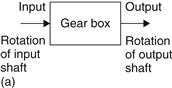
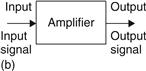
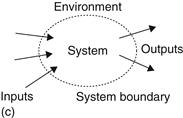
Figure 18.1 Systems: (a) a gear box; (b) an amplifier; (c) the formal picture defining a system
A system can be defined as an arrangement of parts within some boundary which work together to provide some form of output from a specified input or inputs (Figure 18.1(c)). The boundary divides the system from the environment and the system interacts with the environment by means of signals crossing the boundary from the environment to the system; that is inputs, and signals crossing the boundary from the system to the environment, i.e., outputs.
With an engineering system an engineer is more interested in the inputs and outputs of a system than the internal workings of the component elements of that system. By considering devices as systems we can concentrate on what they do rather than their internal workings.
Thus if we know the relationship between the output and the input of a system we can work out how it will behave whether it be a mechanical, pneumatic, hydraulic, electrical or electronic system. We can see the overall picture without becoming bogged down by internal detail. An operational amplifier is an example of this approach. We can design circuits involving operational amplifiers by making use of the known relationship between input and output without knowing what is going on inside it.
In this book we are concerned with control systems. Control systems are systems that are used to maintain a desired result or value (Figure 18.2). For example, driving a car along a road involves the brain of the driver as a controller comparing the actual position of the car on the road with the desired position and making adjustments to correct any error between the desired and actual position. A room thermostat is another example of a controller, it controlling the heating system to give the required room temperature by switching the heater on or off to reduce the error between the actual temperature and the required temperature.
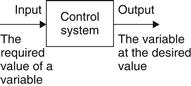
Figure 18.2 Control system: an input of the required value of some variable and an output of the variable at the desired value
With a systems approach to control, we express the physical system in terms of a model with the various physical components described as system blocks with inputs and outputs and the relationship between the inputs and outputs expressed by means of a mathematical equation.
18.2.1 Block Diagrams
A useful way of representing a system is as a block diagram: within the boundary described by the box outline is the system and inputs to the system are shown by arrows entering the box and outputs by arrows leaving the box. Figure 18.3(a) illustrates this for an electric motor system; there is an input of electrical energy and an output of mechanical energy in the form of the rotation of the motor shaft. We can think of the system in the box operating on the input to produce the output.
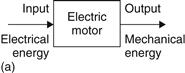
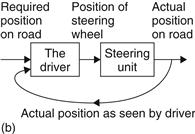
Figure 18.3 Examples of block diagrams to represent systems: (a) an electric motor; (b) a car driving system involving a number of blocks
While we can represent a control system as a single block with an input and an output, it is generally more useful to consider the system as a series of interconnected system elements with each system element being represented by a block having a particular function. Thus, in the case of the driver of a car steering the car along a road we can consider the overall control system to have the elements of: the driver with an input of the actual position he/she sees of the car on the road and also his/her thoughts on where the car should be in relation to the road giving an output of the hands turning the steering wheel; the car steering unit with the input of the steering wheel position and the output of the front wheel positions and hence the positioning of the car on the road. Figure 18.3(b) shows how we might represent these elements.
In drawing formal block diagram models we use a number of conventions to represent the elements and connections:
A system element is shown as a box with an input shown as an inward directed arrow and an output as an outward directed arrow (Figure 18.4(a)).
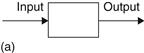
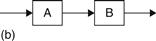
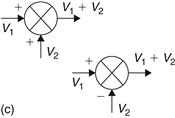

Figure 18.4 Block diagram elements: (a) system element; (b) information paths;(c) summing junction; (d) takeoff point
A control system will be made up of a number of interconnected systems and we can draw a model of such a system as a series of interconnected blocks. Thus we can have one box giving an output which then becomes the input for another box (Figure 18.4(b)). We draw a line to connect the boxes and indicate a flow of information in the direction indicated by the arrow; the lines does not necessarily represent a physical connection or the form of a physical connection.
We often have situations with control systems where two signals are perhaps added together or one subtracted from another and the result of such operations then fed on to some system element. This is represented by a circle with the inputs to quadrants of the circle given + or – signs to indicate whether we are summing two positive quantities or summing a positive quantity and a negative quantity and so subtracting signals (Figure 18.4(c)).
In the case of the car driving system shown in Figure 18.3(b), the overall output is the actual position of the car on the road. But this signal is also tapped off to become an input to the car driver so that he or she can compare the actual position with the required position to adjust the steering wheel accordingly. As another illustration, in the case of a central heating system the overall output is the temperature of a room. But this temperature signal is also tapped off to become an input to the thermostat system where it is compared with the required temperature signal. Such a “tapping-off” point in the system is represented as shown in Figure 18.4(d).
As an illustration of the use of the above elements in drawing a block diagram model for a control system, consider a central heating control system with its input the temperature required in the house and as its output the house at that temperature. Figure 18.5 shows how we can represent such a system with a block diagram.
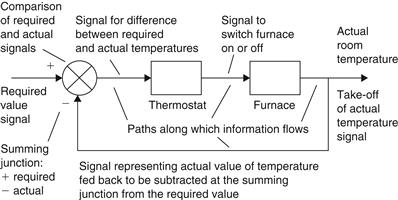
Figure 18.5 Block diagram for a central heating system employing negative feedback
The required temperature is set on the thermostat and this element gives an output signal which is used to switch on or off the heating furnace and so produce an output affecting the variable which is the room temperature. The room temperature provides a signal which is fed back to the thermostat. This responds to the difference between the required temperature signal and the actual temperature signal.
Leave a Reply