
The amount of money shelled out on data is enormous. According to IDC, the spending on Big Data and analytics solutions is forecasted to go from $166 billion in 2018 to $260 billion by 2022.11 This represents an 11.9% compound annual growth rate. The biggest spenders include banks, discrete manufacturers, process manufacturers, professional service firms, and the federal government. They account for close to half the overall amount.
Here’s what IDC’s Jessica Goepfert—the program vice president (VP) of Customer Insights and Analysis—said:
At a high level, organizations are turning to Big Data and analytics solutions to navigate the convergence of their physical and digital worlds. This transformation takes a different shape depending on the industry. For instance, within banking and retail—two of the fastest growth areas for Big Data and analytics—investments are all about managing and reinvigorating the customer experience. Whereas in manufacturing, firms are reinventing themselves to essentially be high tech companies, using their products as a platform to enable and deliver digital services. 12
But a high level of spending does not necessarily translate into good results. A Gartner study estimates that roughly 85% of Big Data projects are abandoned before they get to the pilot stage.13 Some of the reasons include the following:
- Lack of a clear focus
- Dirty data
- Investment in the wrong IT tools
- Problems with data collection
- Lack of buy-in from key stakeholders and champions in the organization
In light of this, it is critical to have a data process. Notwithstanding there are many approaches—often extoled by software vendors—there is one that has widespread acceptance. A group of experts, software developers, consultants, and academics created the CRISP-DM Process in the late 1990s. Take a look at Figure 2-1 for a visual.
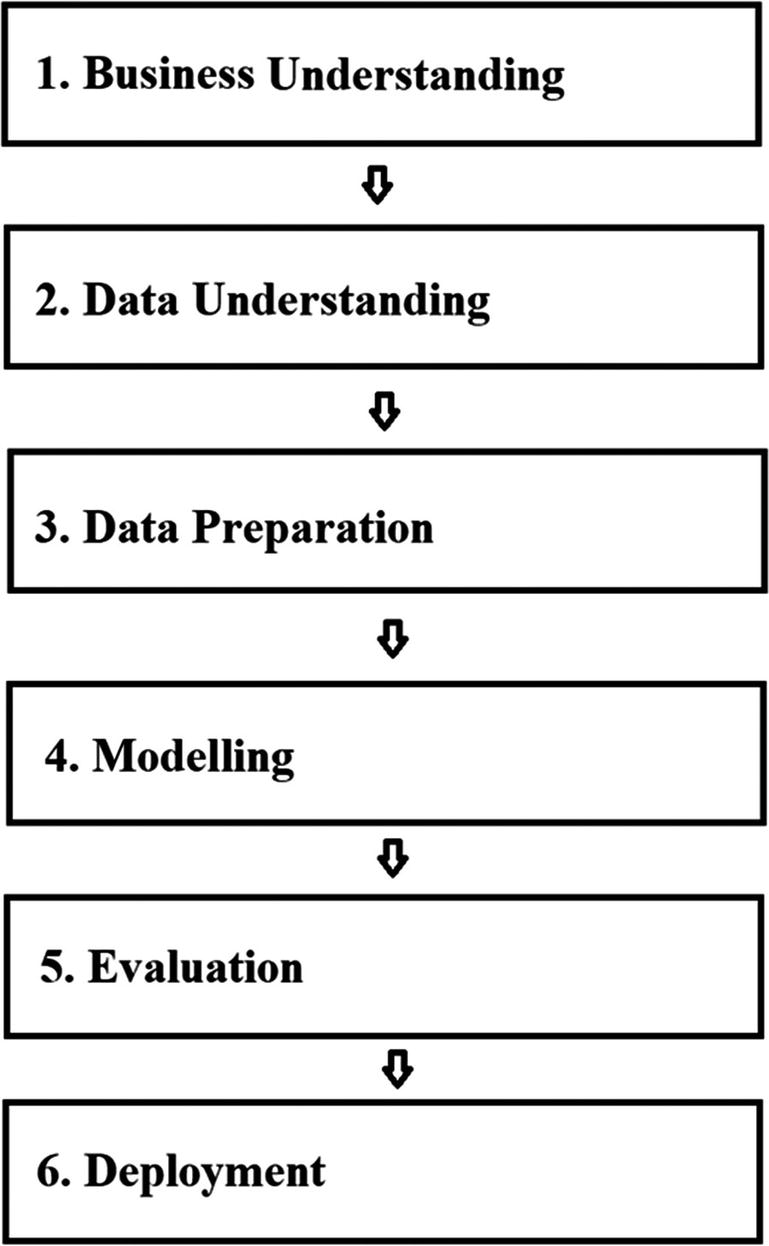
In this chapter, we’ll take a look at steps #1 through #3. Then in the rest of the book, we’ll cover the remaining ones (that is, we will look at Modelling and Evaluation in Chapter 3 and Deployment in Chapter 8).
Note that steps #1–#3 can account for 80% of the time of the data process, which is based on the experience of Atif Kureishy, who is the global VP of Emerging Practices at Teradata.14 This is due to factors like: The data is not well organized and comes from different sources (whether from different vendors or silos in the organization), there is not enough focus on automation tools, and the initial planning was insufficient for the scope of the project.
It’s also worth keeping in mind that the CRISP-DM Process is not a strict linear process. When dealing with data, there can be much iteration. For example, there may be multiple attempts at coming up with the right data and testing it.
Step #1—Business Understanding
You should come up with a clear view of the business problem to be solved. Some examples:
- How might a price adjustment impact your sales?
- Will a change in copy lead to improved conversion of digital ads?
- Does a fall in engagement mean there will be an increase in churn?
Then, you must establish how you will measure success. Might it be that sales should increase by at least 1% or that conversions should rise by 5%?
Here’s a case from Prasad Vuyyuru, who is a partner at the Enterprise Insights Practice of Infosys Consulting:
Identifying which business problem to solve using AI and assessing what value will be created are critical for the success of all AI projects. Without such diligent focus on business value, AI projects risk not getting adopted in the organization. AB Inbev’s experience in using AI to identify packaging line motors that are likely to fail is a great example of how AI is creating practical value. ABInbev installed 20 wireless sensors to measure vibrations at packaging lines motors. They compared sounds with normally functioning motors to identify anomalies which predicted eventual failure of the motors.15
Regardless of the goal, it’s essential that the process be free of any prejudgments or bias. The focus is to find the best results. No doubt, in some cases, there will not be a satisfactory result.
Or, in other situations, there may be big surprises. A famous example of this comes from the book Moneyball by Michael Lewis, which was also made into a movie in 2011 that starred Brad Pitt. It’s a true story of how the Oakland A’s used data science techniques to recruit players. The tradition in baseball was to rely on metrics like batting averages. But when using sophisticated data analytics techniques, there were some startling results. The Oakland A’s realized that the focus should be on slugging and on-base percentages. With this information, the team was able to recruit high-performing players at lower compensation levels.
The upshot is that you need to be open minded and willing to experiment.
In step #1, you should also assemble the right team for the project. Now unless you work at a company like Facebook or Google, you will not have the luxury of selecting a group of PhDs in machine learning and data science. Such talent is quite rare—and expensive.
But you also do not need an army of top-notch engineers for an AI project either. It is actually getting easier to apply machine learning and deep learning models, because of open source systems like TensorFlow and cloud-based platforms from Google, Amazon.com, and Microsoft. In other words, you may only need a couple people with a background in data science.
Next, you should find people—likely from your organization—who have the right domain expertise for the AI project. They will need to think through the workflows, models, and the training data—with a particular understanding of the industry and customer requirements.
Finally, you will need to evaluate the technical needs. What infrastructure and software tools will be used? Will there be a need to increase capacity or purchase new solutions?
Step #2—Data Understanding
In this step, you will look at the data sources for the project. Consider that there are three main ones, which include the following:
- In-House Data: This data may come from a web site, beacons in a store location, IoT sensors, mobile apps, and so on. A major advantage of this data is that it is free and customized to your business. But then again, there are some risks. There can be problems if there has not been enough attention on the data formatting or what data should be selected.
- Open Source Data: This is usually freely available, which is certainly a nice benefit. Some examples of open source data include government and scientific information. The data is often accessed through an API, which makes the process fairly straightforward. Open source data is also usually well formatted. However, some of the variables may not be clear, and there could be bias, such as being skewed to a certain demographic.
- Third-Party Data: This is data from a commercial vendor. But the fees can be high. In fact, the data quality, in some cases, may be lacking.
According to Teradata—based on the firm’s own AI engagements—about 70% of data sources are in-house, 20% from open source, and the rest from commercial vendors.16 But despite the source, all data must be trusted. If not, there will likely be the problem of “garbage in, garbage out.”
To evaluate the data, you need to answer questions like the following:
- Is the data complete? What might be missing?
- Where did the data come from?
- What were the collection points?
- Who touched the data and processed it?
- What have been the changes in the data?
- What are the quality issues?
If you are working with structured data, then this stage should be easier. However, when it comes to unstructured and semi-structured data, you will need to label the data—which can be a protracted process. But there are some tools emerging in the market that can help automate this process.
Step #3—Data Preparation
The first step in the data preparation process is to decide what datasets to use.
Let’s take a look at a scenario: Suppose you work for a publishing company and want to put together a strategy to improve customer retention. Some of the data that should help would include demographic information on the customer base like age, sex, income, and education. To provide more color, you can also look at browser information. What type of content interests customers? What’s the frequency and duration? Any other interesting patterns—say accessing information during weekends? By combining the sources of information, you can put together a powerful model. For example, if there is a drop-off in activity in certain areas, it could pose a risk of cancellation. This would alert sales people to reach out to the customers.
While this is a smart process, there are still landmines. Including or excluding even one variable can have a significant negative impact on an AI model. To see why, look back at the financial crisis. The models for underwriting mortgages were sophisticated and based on huge amounts of data. During normal economic times, they worked quite well as major financial institutions like Goldman Sachs, JP Morgan, and AIG relied on them heavily.
But there was a problem: The models did not account for falling housing prices! The main reason was that—for decades—there had never been a national drop. The assumption was that housing was mostly a local phenomenon.
Of course, housing prices more than just fell—they plunged. The models then proved to be far off the mark, and billions of dollars in losses nearly took down the US financial system. The federal government had little choice but to lend $700 billion for a bailout of Wall Street.
Granted, this is an extreme case. But it does highlight the importance of data selection. This is where having a solid team of domain experts and data scientists can be essential.
Next, when in the data preparation stage, there will need to be data cleansing. The fact is that all data has issues. Even companies like Facebook have gaps, ambiguities, and outliers in their datasets. It’s inevitable.
So here are some actions you can take to cleanse the data:
- De-duplication: Set tests to identify any duplications and delete the extraneous data.
- Outliers: This is data that is well beyond the range of most of the rest of the data. This may indicate that the information is not helpful. But of course, there are situations where the reverse is true. This would be for fraud deduction.
- Consistency: Make sure you have clear definitions for the variables. Even terms like “revenue” or “customer” can have multiple meanings.
- Validation Rules: As you look at the data, try to find the inherent limitations. For example, you can have a flag for the age column. If it is over 120 in many cases, then the data has some serious issues.
- Binning: Certain data may not need to be specific. Does it really matter if someone is 35 or 37? Probably not. But comparing those from 30–40 to 41–50 probably would.
- Staleness: Is the data timely and relevant?
- Merging: In some cases, the columns of data may have very similar information. Perhaps one has height in inches and another in feet. If your model does not require a more detailed number, you can just use the one for feet.
- One-Hot Encoding : This is a way to replace categorical data as numbers. Example: Let’s say we have a database with a column that has three possible values: Apple, Pineapple, and Orange. You could represent Apple as 1, Pineapple as 2, and Orange as 3. Sounds reasonable, right? Perhaps not. The problem is that an AI algorithm may think that Orange is greater than Apple. But with one-hot encoding, you can avoid this problem. You will create three new columns: is_Apple, is_Pineapple, and is_Orange. For each row in the data, you’ll put 1 for where the fruit exists and 0 for the rest.
- Conversion Tables: You can use this when translating data from one standard to another. This would be the case if you have data in the decimal system and want to move over to the metric system.
These steps will go a long way in improving the quality of the data. There are also automation tools that can help out, such as from companies like SAS, Oracle, IBM, Lavastorm Analytics, and Talend. Then there are open source projects, such as OpenRefine, plyr, and reshape2.
Regardless, the data will not be perfect. No data source is. There will likely still be gaps and inaccuracies.
This is why you need to be creative. Look at what Eyal Lifshitz did, who is the CEO of BlueVine. His company leverages AI to provide financing to small businesses. “One of our data sources is credit information of our customers,” he said. “But we’ve found that small business owners incorrectly identify their type of business. This could mean bad results for our underwriting. To deal with this, we scrape data from the customer website with AI algorithms, which helps identify the industry.”17
Data cleansing approaches will also depend on the use cases for the AI project. For example, if you are building a system for predictive maintenance in manufacturing, the challenge will be to handle the wide variations from different sensors. The result is that a large amount of the data may have little value and be mostly noise.
Leave a Reply