
The k-Means clustering algorithm, which is effective for large datasets, puts similar, unlabeled data into different groups. The first step is to select k, which is the number of clusters. To help with this, you can perform visualizations of that data to see if there are noticeable grouping areas.
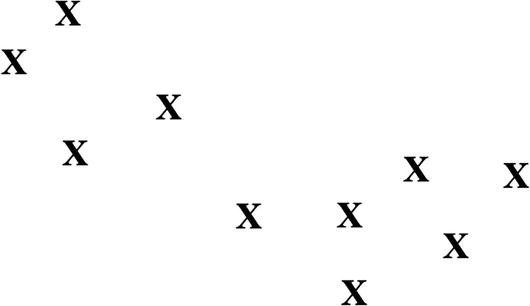
Here’s a look at sample data, in Figure 3-6:
For this example, we assume there will be two clusters, and this means there will also be two centroids. A centroid is the midpoint of a cluster. We will assign each randomly, which you can see in Figure 3-7.

As you can see, the centroid at the top left looks way off, but the one on the right side is better. The k-Means algorithm will then calculate the average distances of the centroids and then change their locations . This will be iterated until the errors are fairly minimal—a point that is called convergence, which you can see with Figure 3-8.

Granted, this is a simple illustration. But of course, with a complex dataset, it will be difficult to come up with the number of initial clusters. In this situation, you can experiment with different k values and then measure the average distances. By doing this multiple times, there should be more accuracy.
Then why not just have a high number for k? You can certainly do this. But when you compute the average, you’ll notice that there will be only incremental improvements. So one method is to stop at the point where this starts to occur. This is seen in Figure 3-9.

However, k-Means has its drawbacks . For instance, it does not work well with nonspherical data, which is the case with Figure 3-10.

With this, the k-Means algorithm would likely not pick up on the surrounding data, even though it has a pattern. But there are some algorithms that can help, such as DBScan (density-based spatial clustering of applications with noise), which is meant to handle a mix of widely varying sizes of datasets. Although, DBScan can require lots of computational power.
Next, there is the situation where there are some clusters with lots of data and others with little. What might happen? There is a chance that the k-Means algorithm will not pick up on the light one. This is the case with Figure 3-11.

Leave a Reply