
Calculation of any of the variables p, T, ![]() , and z using the generalized equation p
, and z using the generalized equation p![]() = zRT can be assisted by using graphs called generalized compressibility charts, or z factor charts.
= zRT can be assisted by using graphs called generalized compressibility charts, or z factor charts.
Four parameters are displayed in Figure 7.7. Any two values will fix a point from which you can determine the other two. For example, if pr and Tr are known (point 1), the value of ![]() can be determined by interpolating between the two closest curves of
can be determined by interpolating between the two closest curves of ![]() , and z can be determined by drawing a horizontal line from point 1 to the z axis.
, and z can be determined by drawing a horizontal line from point 1 to the z axis.
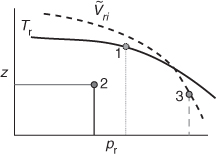
Figure 7.7. A compressibility chart involves four parameters: z, pr, Tr, and ![]() .
.
Figures 7.8a and 7.8b show two examples of the generalized compressibility factor charts prepared by Nelson and Obert.2 These charts are based on data for 30 gases. Figure 7.8a represents z for 26 gases (excluding H2, He, NH3, and H2O) with a maximum deviation of 1%, and H2 and H2O within a deviation of 1.5%. Figure 7.8b is for 9 gases and errors can be as high as 5%. Note that the vertical axis in Figure 7.8b is not z but zTr. To use the charts for H2 and He (only), make corrections to the actual constants to get pseudocritical constants as follows:
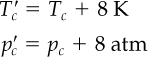
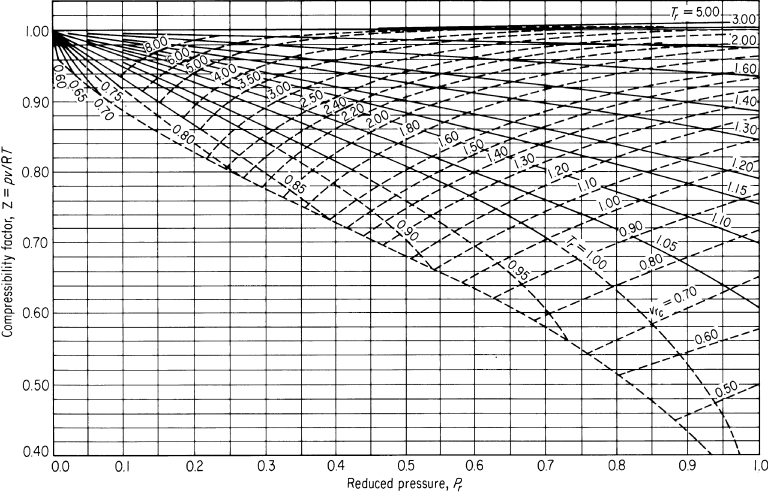
Figure 7.8a. Generalized compressibility chart for lower pressures showing z as a function of pr, Tr, and ![]()
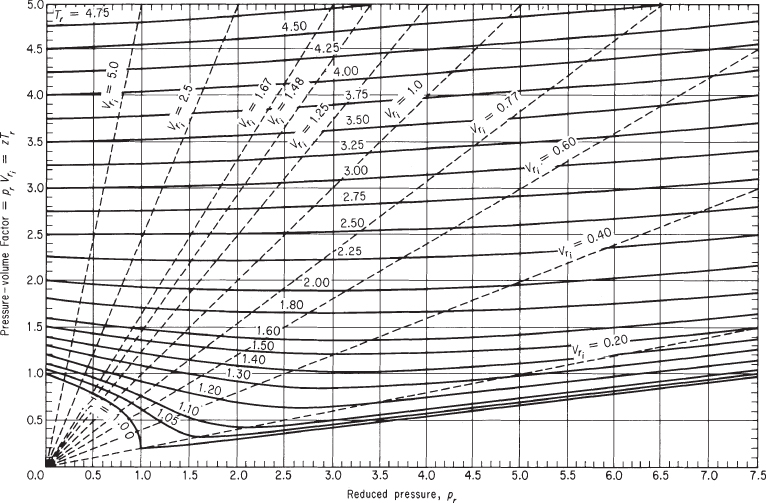
Figure 7.8b. Generalized compressibility chart for higher values of pr
Then you can use Figures 7.8a and 7.8b for these two gases using the pseudocritical constants as replacements for their true values. You will find these two charts and additional charts for other ranges of pr and Tr on the CD that accompanies this book in a format that can be expanded to get better accuracy.
Instead of the reduced specific volume, a third parameter shown on the charts is the dimensionless ideal reduced volume defined by
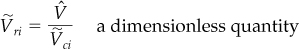
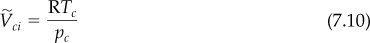
where ![]() is the ideal critical specific volume (not the experimental value of the critical specific volume which yields poorer predictions) and is calculated from
is the ideal critical specific volume (not the experimental value of the critical specific volume which yields poorer predictions) and is calculated from
Both ![]() and
and ![]() are easy to calculate since Tc and pc are presumed known or can be estimated for a compound. The development of the generalized compressibility charts is of considerable practical as well as pedagogical value because their existence enables you to make engineering calculations with considerable ease, and it also permits the development of thermodynamic functions for gases for which no experimental data are available.
are easy to calculate since Tc and pc are presumed known or can be estimated for a compound. The development of the generalized compressibility charts is of considerable practical as well as pedagogical value because their existence enables you to make engineering calculations with considerable ease, and it also permits the development of thermodynamic functions for gases for which no experimental data are available.
Frequently Asked Questions
1. What is in the blank region in Figure 7.8a below the curves for Tr and ![]() ri? The blank region corresponds to a different phase—a liquid.
ri? The blank region corresponds to a different phase—a liquid.
2. Will p![]() = zRT work for a liquid phase? Yes, but relations to calculate z accurately are more complex than those for the gas phase. Also, liquids are not very compressible, so at the moment we can bypass p–
= zRT work for a liquid phase? Yes, but relations to calculate z accurately are more complex than those for the gas phase. Also, liquids are not very compressible, so at the moment we can bypass p–![]() –T relations for liquids.
–T relations for liquids.
3. Why should I use p![]() = zRT when I can look up the data needed in a handbook or on the Web? Although considerable data exists, you can use p
= zRT when I can look up the data needed in a handbook or on the Web? Although considerable data exists, you can use p![]() = zRT to evaluate the accuracy of the data and interpolate within data points. If you do not have data in the range you want, use of p
= zRT to evaluate the accuracy of the data and interpolate within data points. If you do not have data in the range you want, use of p![]() = zRT is the best method of extrapolation. Finally, you may not have any data for the gas of interest.
= zRT is the best method of extrapolation. Finally, you may not have any data for the gas of interest.
Example 7.7. Use of the Compressibility Factor in Calculating a Specific Volume
In spreading liquid ammonia fertilizer, the charges for the amount of NH3 used are based on the time involved plus the pounds of NH3 injected into the soil. After the liquid has been spread, there is still some ammonia left in the source tank (volume = 120 ft3), but in the form of a gas. Suppose that your weight tally, which is obtained by difference, shows a net weight of 125 lb of NH3 left in the tank at 292 psig. Because the tank is sitting in the sun, the temperature in the tank is 125°F.
Your boss complains that his calculations show that the specific volume of the NH3 gas is 1.20 ft3/lb, and hence there are only 100 lb of NH3 in the tank. Could he be correct? See Figure E7.7.
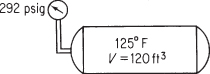
Figure E7.7
Solution
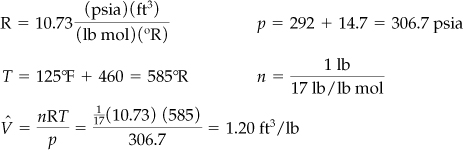
The simplest calculation to make to get the specific volume of the ammonia in the tank is to select a pound or pound mole as a basis:
Basis: 1 lb of NH3
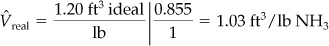
Apparently, your boss used the ideal gas law (z = 1) in getting the figure of 1.20 ft3/lb of NH3 gas:
What should you do? Ammonia probably does not behave like an ideal gas under the observed conditions of temperature and pressure. You can apply pV = znRT to calculate n and determine the real amount of NH3 in the tank if you include the correct compressibility factor in the real gas law. Let’s compute z; z is a function of Tr and pr. You can look up all of the values of the necessary parameters in Appendix F or on the CD.
Tc = 405.5 K ⇒ 729.9°R pc = 111.3 atm ⇒ 1636 psia
Then since

From the Nelson and Obert (N&O) chart, Figure 7.8a, you can read z ≅ 0.855. The value may be somewhat in error because ammonia was not one of the gases included in the preparation of the figure. Rather than calculating the specific volume directly, let’s calculate it from the ratio of pVreal = zrealnRT to pVideal = zidealnRT, the net result of which is

On the basis of 1 lb NH3,
On the basis of 120 ft3 in the tank,
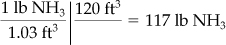
Certainly 117 lb is a more realistic figure than 100 lb, but it still could be in error, considering that the residual weight of the NH3 in the tank is determined by difference.
As a matter of interest, as an alternative to making these calculations, you could look up the specific volume of NH3 at the conditions in the tank in a handbook. You would find that ![]() = 0.973 ft3/lb, equivalent to 123 lb of NH3, the correct value. Would you tell your boss to use the right compressibility factor, or state that you used the handbook value of
= 0.973 ft3/lb, equivalent to 123 lb of NH3, the correct value. Would you tell your boss to use the right compressibility factor, or state that you used the handbook value of ![]() ?
?
If you calculated z from Equation (7.3), you would get
z = z0 + z1ω = 0.864 – 0.107(0.250) = 0.837
What would the mass of ammonia in the tank be using z = 0.873?
Example 7.8. Use of the Compressibility Factor in Calculating a Pressure
Liquid oxygen is used in the steel industry, in the chemical industry, in hospitals, as rocket fuel oxidant, and for wastewater treatment as well as in many other applications. A tank sold to hospitals contains 0.0284 m3 of volume filled with 3.500 kg of liquid O2 that will vaporize at –25°C. After all of the O2 in the tank vaporizes, will the pressure in the tank exceed the safety limit for the tank specified as 104 kPa?
Solution
Basis: 3.500 kg of O2
You can find from Appendix F on the CD that for oxygen
Tc = 154.4 K pc = 49.7 atm ⇒ 5035 kPa
However, you cannot proceed to solve this problem in exactly the same way as the preceding problem because you do not know the pressure of the O2 in the tank to begin with. But you can use the pseudoparameter, ![]() , which is available as a parameter on the Nelson and Obert charts, as a second parameter to fix a point on the compressibility charts.
, which is available as a parameter on the Nelson and Obert charts, as a second parameter to fix a point on the compressibility charts.
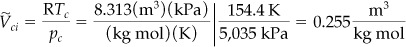
First calculate

Note that the specific molar volume must be used in calculating ![]() since
since ![]() is the volume per mole.
is the volume per mole.
Then
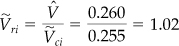
Now you know the values of two parameters, ![]() and
and
From the Nelson and Obert chart (Figure 7.8b) you can read
pr = 1.43
Then
p = prpc
= 1.43(5035) = 7200 kPa
The pressure of 104 kPa will not be exceeded. Even at room temperature the pressure will be less than 104 kPa.
To get one snapshot of the difference between estimates of z by three of the methods discussed in this chapter, Table 7.4 compares the experimental values of z for ethylene with predictions by three methods: N&O charts, Pitzer’s relation, and the ideal gas laws.
Table 7.4. A Comparison of Values of the Compressibility Factor z for Ethylene* Determined via Three Different Methods with the Associated Experimental Values
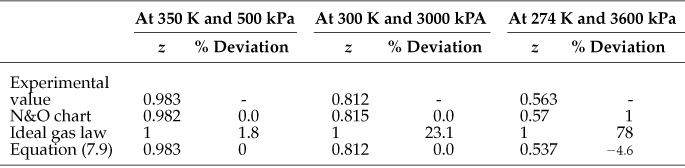
* w = 0.089; Tc = 282.8 K; pc = 50.5 atm; z0 and z1 are from the tables in Appendix C.
Leave a Reply