
To calculate the overall size of global digital marketing business and its growth pattern, we will need to size the global marketing spend across key categories like advertising, marketing services, ad agency/marketing BPO fees, data/intelligence, and software/technology. This would help us clarify the difference between impression and non-impression-based spends.
Figure 10.1 shows data picked up from a 2012 BMO Capital Markets Report. This data was culled from various sources like GroupM, DMA, Winterberry/Acxiom/Teradata, IDC, DemandTec, AdAge Data Center, and provides an estimate of 2020 numbers for all key categories of marketing spend.
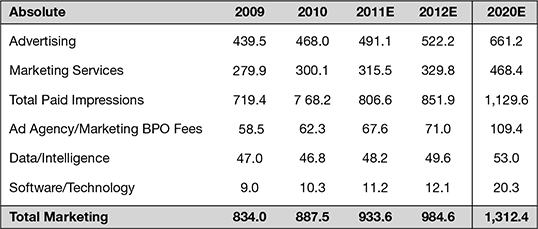
Figure 10.1 Global Marketing Spending by Category
Source: Daniel Salmon, BMO Capital Markets, http://adexchanger.com/Digital-Marketing-Hub-v2.pdf, as accessed on 1 March 2017 at 10.48 am.
As of 2012, the report estimates that the total marketing spend has been $ 1 trillion. This amount can be classified as impression-based and non-impression-based spend, wherein impression spend denotes the total of advertising spend (including TV, radio, newspaper, magazine, internet impressions) and marketing services spend (including content-based impressions—direct mail, email, sponsorships, promotions, public relations). The non-impression-based spend is covered by categories like ad agency/marketing BPO fees, data/intelligence and software/technology. If we add up the numbers, around 87 per cent spend is impression-based while 13 per cent is spent across the multiple categories of non-impression spend.
With an understanding of the overall marketing spend numbers, let us look at the global advertising spend forecast for 2016 (Source: Zenith Optimedia).
In Fig. 10.2, the division of Global Advertising Spend is represented by all traditional and digital media types. Here, the digital advertising numbers are covered by the categories of desktop internet and mobile internet. Since 2015, digital advertising has surpassed print media (includes newspaper and magazines), as the second biggest advertising category after television.
Though television still reigns supreme (with a 38.3 per cent share), the rapid rise of mobile internet is poised to give the top medium a tough fight. At present, the combined share of desktop and mobile internet numbers stands at 28.3 per cent, which is a good 8 per cent rise over 2013 numbers (which stood at 19.7 per cent). In terms of the fastest growing ad markets in absolute terms (2013–16), the top three countries for global advertising spend include the Unites States (grew at 22.7 Mn), China (grew at 15.8 Mn), and Indonesia (grew at 6 Mn). India, with a total spend growth of 1.9 Mn, stands at the tenth position, just behind South Korea.
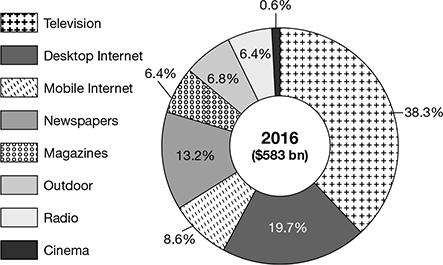
Figure 10.2 Share of Global Advertising Spend by Medium (2016)
Leave a Reply