
Collector testing is required to evaluate the performance of solar collectors and compare different collectors to select the most appropriate one for a specific application. As can be seen from Sections 4.1–4.5, the tests show how a collector absorbs solar energy and how it loses heat. They also show the effects of angle of incidence of solar radiation and the significant heat capacity effects, which are determined from the collector time constant.
Final selection of a collector should be made only after energy analyses of the complete system, including realistic weather conditions and loads, have been conducted for 1 year. In addition, a preliminary screening of collectors with various performance parameters should be conducted to identify those that best match the load. The best way to accomplish this is to identify the expected range of the parameter ΔT/G for the load and climate on a plot of efficiency η as a function of the heat loss parameter, as indicated in Figure 4.11 (Kalogirou, 2004).
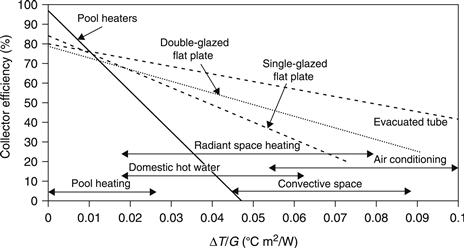
FIGURE 4.11 Collector efficiencies of various liquid collectors.
Collector efficiency curves may be used for preliminary collector selection. However, efficiency curves illustrate only the instantaneous performance of a collector. They do not include incidence angle effects, which vary throughout the year; heat exchanger effects; and probabilities of occurrence of Ti, Ta, solar irradiation, system heat loss, or control strategies. Final selection requires the determination of the long-term energy output of a collector as well as performance cost-effectiveness studies. Estimating the annual performance of a particular collector and system requires the aid of appropriate analysis tools such as f-chart, WATSUN, or TRNSYS. These are presented in Chapter 11.
The collector performance equations can also be used to estimate the daily energy output from the collector. This is illustrated by means of Example 4.2.
EXAMPLE 4.2
Consider an FPC with the following characteristics:


Find the energy collected during a day with the characteristics shown in Table 4.3.
Table 4.3
Data Collected for Example 4.2
| Solar Time | Ambient Temperature, Ta (°C) | Solar Radiation, Gt (W/m2) |
| 6 | 25 | 100 |
| 7 | 26 | 150 |
| 8 | 28 | 250 |
| 9 | 30 | 400 |
| 10 | 32 | 600 |
| 11 | 34 | 800 |
| 12 | 35 | 950 |
| 13 | 34 | 800 |
| 14 | 32 | 600 |
| 15 | 30 | 400 |
| 16 | 28 | 250 |
| 17 | 26 | 150 |
| 18 | 25 | 100 |
The collector area is 2 m2, located at 35°N latitude, is south-facing and tilted at 45° from horizontal. The estimation is done on June 16 and collector inlet temperature is constant equal to 50 °C.
Solution
As the weather conditions are given for every hour, the estimation is performed on an hourly basis, during which it is considered that the weather conditions remain constant. The most difficult parameter to consider is Ti, the inlet temperature to the collector, which is dependent on the system and its location. In this example, this is considered as constant throughout the day and equal to 50 °C.
The efficiency η is equal to Qu/AcIt. Therefore,

The angle of incidence required for the estimation of the incidence angle modifier, Kθ, is obtained from Eq. (2.20). The declination on June 16 is 23.35°. It should be noted that, for the estimation of ΔT/Gt, the radiation used is in W/m2, whereas for the estimation of Qu irradiation in kJ/m2 is used, obtained by multiplying W/m2 by 3.6. The results are shown in Table 4.4.
Table 4.4
Results of Example 4.2
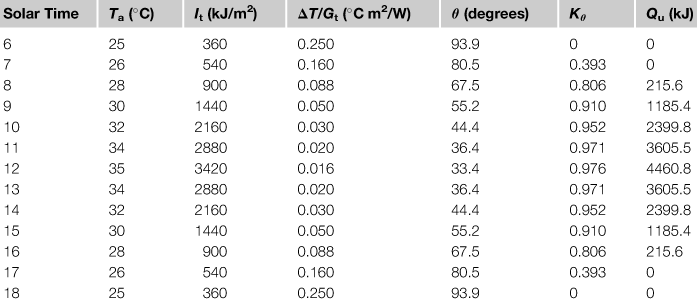
Therefore, the total energy collected over the day = 19,273.4 kJ.
In this example, the use of a spreadsheet program greatly facilitates estimations.
Leave a Reply