
The operating principle of indirect collection systems involves the implementation of two separate subsystems: a renewable energy collection system (solar collector, pressure vessel (PV), wind turbine, etc.) and a plant for transforming the collected energy to freshwater. Some examples employing renewable energy to power desalination plants are presented in this section; a more extensive review is presented in Section 8.5. The plant subsystem is based on one of the following two operating principles:
• Phase change processes, for which multi-stage flash (MSF), multiple-effect boiling (MEB), or vapor compression (VC) is used.
• Membrane processes, for which reverse osmosis (RO) or electrodialysis (ED) is applied.
The operating principle of phase change processes entails reusing the latent heat of evaporation to preheat the feed while at the same time condensing steam to produce freshwater. The energy requirements of these systems are traditionally defined in terms of units of distillate produced per unit mass (kg or lb) of steam or per 2326 kJ (1000 Btu) heat input, which corresponds to the latent heat of vaporization at 73 °C. This dimensional ratio in kg/2326 kJ or lb/1000 Btu is known as the performance ratio (PR) (El-Sayed and Silver, 1980). The operating principle of membrane processes leads to the direct production of electricity from solar or wind energy, which is used to drive the plant. Energy consumption is usually expressed in kWhe/m3 (Kalogirou, 1997b).
8.4.1 The multi-stage flash process
The multi-stage flash (MSF) process is composed of a series of elements, called stages. In each stage, condensing steam is used to preheat the seawater feed. By fractionating the overall temperature differential between the warm source and seawater into a large number of stages, the system approaches ideal total latent heat recovery. Operation of this system requires pressure gradients in the plant. The principle of operation is shown in Figure 8.4. Current commercial installations are designed with 10–30 stages (2 °C temperature drop per stage).
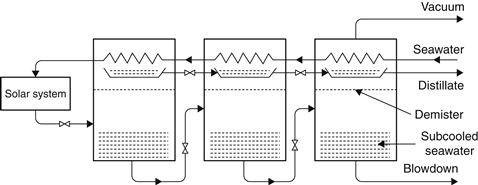
FIGURE 8.4 Principle of operation of the multi-stage flash (MSF) system.
A practical cycle representing the MSF process is shown in Figure 8.5. The system is divided into heat recovery and heat rejection sections. Seawater is fed through the heat rejection section, which rejects thermal energy from the plant and discharges the product and brine at the lowest possible temperature. The feed is then mixed with a large mass of water, which is recirculated around the plant. This water then passes through a series of heat exchangers to raise its temperature. The water next enters the solar collector array or a conventional brine heater to raise its temperature to nearly the saturation temperature at the maximum system pressure. The water then enters the first stage through an orifice and, in so doing, has its pressure reduced. Since the water was at the saturation temperature for a higher pressure, it becomes superheated and flashes into steam. The vapor produced passes through a wire mesh (demister) to remove any entrained brine droplets and then into the heat exchanger, where it is condensed and drips into a distillate tray. This process is repeated through the plant because both brine and distillate streams flash as they enter subsequent stages that are at successively lower pressures. In MSF, the number of stages is not tied rigidly to the PR required from the plant. In practice, the minimum must be slightly greater than the PR, whereas the maximum is imposed by the boiling point elevation. The minimum interstage temperature drop must exceed the boiling point elevation for flashing to occur at a finite rate. This is advantageous because, as the number of stages is increased, the terminal temperature difference over the heat exchangers increases and hence less heat transfer area is required, with obvious savings in plant capital cost (Morris and Hanbury, 1991).
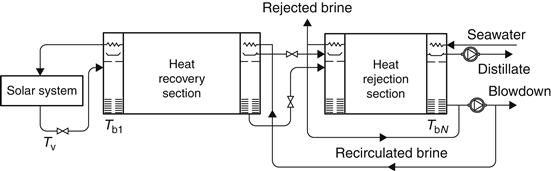
FIGURE 8.5 An multi-stage flash (MSF) process plant.
MSF is the most widely used desalination process in terms of capacity. This is due to the simplicity of the process, performance characteristics, and scale control (Kalogirou, 1997b). A disadvantage of MSF is that precise pressure levels are required in the different stages; therefore, some transient time is required to establish the normal running operation of the plant. This feature makes the MSF relatively unsuitable for solar energy applications unless a storage tank is used for thermal buffering.
For the MSF system (El-Sayed and Silver, 1980),
![]() (8.35)
(8.35)
Md = mass rate of distillate (kg/h).
Mf = mass rate of feed (kg/h).
Lv = average latent heat of vaporization (kJ/kg).
cp = mean specific heat under constant pressure for all liquid streams (kJ/kg K).
N = total number of stages or effects.
The flashing temperature range, ΔF, according to the temperatures shown in Figure 8.5, is given by:
![]() (8.36)
(8.36)
Th = top brine temperature (K).
TbN = temperature of brine in the last effect (K).
Tb1 = temperature of brine in first effect (K).
It should be noted that the rate of external feed per unit of product Mf/Md is governed by the maximum brine concentration. Therefore,
![]() (8.37)
(8.37)
ybN = mass fraction of salts in brine in the last effect (dimensionless).
yf = mass fraction of salts of feed (dimensionless).
The total thermal load per unit product is obtained by adding all loads, Q, and approximating (N − 1)/N = 1 and is given by (El-Sayed and Silver, 1980):
![]() (8.38)
(8.38)
Mr = mass rate of recirculated brine (kg/h).
To = environmental temperature (K).
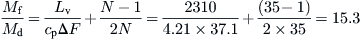
EXAMPLE 8.4
Estimate Mf/Md ratio for an MSF plant, which has 35 stages, brine temperature in first effect is 71 °C, and the temperature of the brine in the last effect is 35 °C. The mean latent heat is 2310 kJ/kg and the mean specific heat is 4.21 kJ/kg K.
Solution
From Eq. (8.36),

From Eq. (8.35),
The brine recycle flow rate can be obtained from the brine heater energy balance. The energy given by the heating steam (subscript s) is equal to:
![]() (8.39)
(8.39)
By dividing Eq. (8.39) by the mass rate of distillate (Md) and rearranging:
![]() (8.40)
(8.40)
The term Md/Mr is the system performance ratio (PR). The cooling water flow rate (subscript cw) is obtained from the energy balance of the whole system shown in Figure 8.5 which gives:
![]() (8.41)
(8.41)
Dividing Eq. (8.41) by the mass rate of distillate (Md):
 (8.42)
where as before Md/Mr is the system PR and the ratio Md/Mf is called the system conversion ratio (CR). Therefore, Eq. (8.42) can be written as:
![]() (8.43)
(8.43)
It should be noted that the term 1/CR is given by Eq. (8.37).
Moustafa et al. (1985) report on the performance of a 10 m3/day solar MSF desalination system tested in Kuwait. The system consisted of 220 m2 parabolic trough collectors (PTCs), 7000 l of thermal storage, and a 12-stage MSF desalination system. The thermal storage system was used to level off the thermal energy supply and allowed the production of freshwater to continue during periods of low solar radiation and nighttime. The output of the system is reported to be more than 10 times the output of solar stills for the same solar collection area.
8.4.2 The multiple-effect boiling process
The multiple-effect boiling (MEB) process shown in Figure 8.6 is also composed of a number of elements, which are called effects. The steam from one effect is used as heating fluid in another effect, which, while condensing, causes evaporation of a part of the salty solution. The produced steam goes through the following effect, where, while condensing, it makes some of the other solution evaporate, and so on. For this procedure to be possible, the heated effect must be kept at a pressure lower than that of the effect from which the heating steam originates. The solutions condensed by all effects are used to preheat the feed. In this process, vapor is produced by flashing and by boiling, but the majority of the distillate is produced by boiling. Unlike an MSF plant, the MEB process usually operates as a once-through system without a large mass of brine recirculating around the plant. This design reduces both pumping requirements and scaling tendencies (Kalogirou, 1997b).
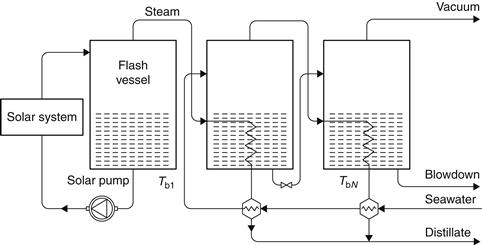
FIGURE 8.6 Principle of operation of a multiple-effect boiling (MEB) system.
As with the MSF plant, the incoming brine in the MEB process passes through a series of heaters, but after passing through the last of these, instead of entering the brine heater, the feed enters the top effect, where the heating steam raises its temperature to the saturation temperature for the effect pressure. Further amounts of steam, from either a solar collector system or a conventional boiler, are used to produce evaporation in this effect. The vapor then goes, in part, to heat the incoming feed and, in part, to provide the heat supply for the second effect, which is at a lower pressure and receives its feed from the brine of the first effect. This process is repeated all the way through (down) the plant. The distillate also passes down the plant. Both the brine and the distillate flash as they travel down the plant due to progressive reduction in pressure (Kalogirou, 1997b).
There are many possible variations of MEB plants, depending on the combinations of heat transfer configurations and flow sheet arrangements used. Early plants were of the submerged tube design and used only two or three effects. In modern systems, the problem of low evaporation rate has been resolved by using thin film designs with the feed liquid distributed on the heating surface in the form of a thin film instead of a deep pool of water. Such plants may have vertical or horizontal tubes. The vertical tube designs are of two types: climbing film, natural, and forced circulation type or long tube vertical (LTV), straight falling film type. In LTV plants, as shown in Figure 8.7, the brine boils inside the tubes and the steam condenses outside. In the horizontal tube, falling film design, the steam condenses inside the tube with the brine evaporating on the outside. With multiple evaporation, the underlying principle is to use the available energy of the leaving streams of a single-evaporation process to produce more distillate.
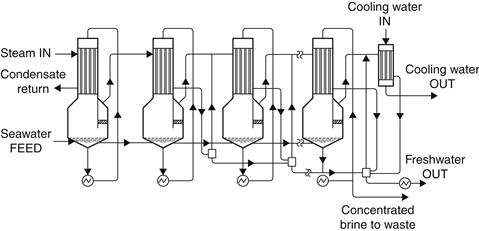
FIGURE 8.7 Long tube vertical MEB plant.
In the case of the MEB system, the ratio Mf/Md is fixed by the maximum allowable brine concentration to a value on the order of 2 and is given by (El-Sayed and Silver, 1980):
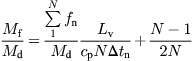 (8.44)
fn = mass rate of distillate obtained by flashing per stage (kg/h).
Δtn = temperature drop between two effects consisting of the heat transfer temperature difference and an augmented boiling point elevation (K).
The total thermal load per unit product obtained by adding all loads, Q, and dividing by Md is given by (El-Sayed and Silver, 1980):
![]() (8.45)
(8.45)
ε = boiling point rise augmented by vapor frictional losses (K).
Δtt = terminal temperature difference in feed heater condenser (K).
According to the analysis given by Al-Sahali and Ettouney (2007) who presented a modified analysis of Geankoplis (2003), the temperature drop across all effects is given by:
![]() (8.46)
(8.46)
Where subscript t is for total and ΔT represents temperature losses in each evaporation effect. Temperature drop in the first effect is given by:
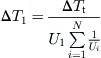 (8.47)
And the temperature drop in effects 2-N is given by:
![]() (8.48)
(8.48)
The brine temperature in the first effect is obtained from:
![]() (8.49)
(8.49)
And the brine temperature in the effects 2-N is given by:
![]() (8.50)
(8.50)
The distillate flow rate in the first effect is:
![]() (8.51)
(8.51)
Distillate flow rate in the effects 2-N is:
![]() (8.52)
(8.52)
The brine flow rate in various effects is given by:
![]() (8.53)
(8.53)
ycw = mass fraction of salts in cooling seawater (dimensionless).
And the feed rate in various effects is given by:
![]() (8.54)
(8.54)
The heating steam flow rate is given by:
![]() (8.55)
(8.55)
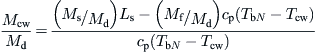
The flow rate of the cooling seawater is given by:
![]() (8.56)
(8.56)
With respect to the size of the equipment, the heat transfer area in the first effect is given by:
![]() (8.57)
(8.57)
The heat transfer area in the effects 2-N is given by:
![]() (8.58)
(8.58)
And the heat transfer area of the condenser (subscript c) is given by:
![]() (8.59a)
(8.59a)
where
LMTD = log mean temperature difference given by:
![]() (8.59b)
(8.59b)
in which ΔT1 and ΔT2 represent the temperature difference between the two fluids at the inlet and outlet of the condenser. It makes no difference which side of the condenser is designated as the inlet or the outlet.
Another type of MEB evaporator is the multiple-effect stack (MES). This is the most appropriate type for solar energy applications. It has a number of advantages, the most important of which is its stable operation between virtually 0% and 100% output, even when sudden changes are made, and its ability to follow a varying steam supply without upset. In Figure 8.8, a four-effect MES evaporator is shown. Seawater is sprayed into the top of the evaporator and descends as a thin film over the horizontally arranged tube bundle in each effect. In the top (hottest) effect, steam from a steam boiler or a solar collector system condenses inside the tubes. Because of the low pressure created in the plant by the vent–ejector system, the thin seawater film boils simultaneously on the outside of the tubes, thus creating new vapor at a lower temperature than the condensing steam.
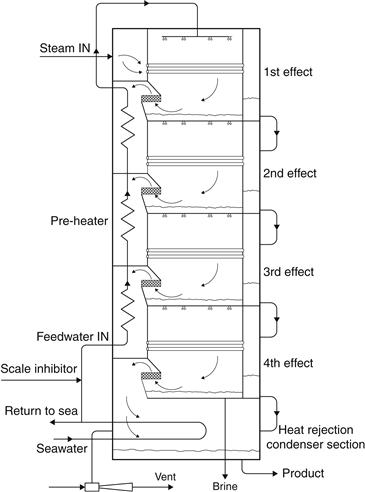
FIGURE 8.8 Schematic of the MES evaporator.
The seawater falling to the floor of the first effect is cooled by flashing through nozzles into the second effect, which is at a lower pressure. The vapor made in the first effect is ducted into the inside of the tubes in the second effect, where it condenses to form part of the product. Furthermore, the condensing warm vapor causes the external cooler seawater film to boil at the reduced pressure.
The evaporation–condensation process is repeated from effect to effect in the plant, creating an almost equal amount of product inside the tubes of each effect. The vapor made in the last effect is condensed on the outside of a tube bundle cooled by raw seawater. Most of the warmer seawater is then returned to the sea, but a small part is used as feedwater to the plant. After being treated with acid to destroy scale-forming compounds, the feedwater passes up the stack through a series of preheaters that use a little of the vapor from each effect to raise its temperature gradually, before it is sprayed into the top of the plant. The water produced from each effect is flashed in a cascade down the plant so that it can be withdrawn in a cool condition at the bottom of the stack. The concentrated brine is also withdrawn at the bottom of the stack. The MES process is completely stable in operation and automatically adjusts to changing steam conditions, even if they are suddenly applied, so it is suitable for load-following applications. It is a once-through process that minimizes the risk of scale formation without incurring a large chemical scale dosing cost. The typical product purity is less than 5 ppm TDS and does not deteriorate as the plant ages. Therefore, the MEB process with the MES-type evaporator appears to be the most suitable for use with solar energy.
A 14-effect MEB plant with a nominal output of 3 m3/h coupled with 2672 m2 PTCs was reported by Zarza et al. (1991a, b). The system is installed at the Plataforma Solar de Almeria in southern Spain. It also incorporates a 155 m3 thermocline thermal storage tank. The circulated fluid through the solar collectors is a synthetic oil heat transfer fluid. The PR obtained by the system varies from 9.3 to 10.7, depending on the condition of the evaporator tube–bundle surfaces. The authors estimated that the efficiency of the system can be increased considerably by recovering the energy wasted when part of the cooling water in the final condenser is rejected. Energy recovery is performed with a double-effect absorption heat pump.
El-Nashar (1992) gives details of an MES system powered with 1862 m2 evacuated tube collectors. The system is installed in Abu Dhabi, United Arab Emirates. A computer program was developed for the optimization of the operating parameters of the plant that affect its performance, that is, the collector area in service, the high-temperature collector set point, and the heating water flow rate. The maximum daily distillate production corresponding to the optimum operating conditions was found to be 120 m3/day, which can be obtained for 8 months of the year.
Exergy analysis, based on actual measured data of the MES plant installed in the solar plant near Abu Dhabi, is presented by El-Nashar and Al-Baghdadi (1998). The exergy destruction was calculated for each source of irreversibility. The major exergy destruction was found to be caused by irreversibilities in the different pumps, with the vacuum pump representing the main source of destruction.
Major exergy losses are associated with the effluent streams of distillate, brine blowdown, and seawater. Exergy destruction due to heat transfer and pressure drop in the different effects, the preheaters, and the final condenser and in the flashing of the brine and distillate between the successive effects represents an important contribution to the total amount of exergy destruction in the evaporator.
8.4.3 The vapor compression process
In a vapor compression (VC) plant, heat recovery is based on raising the pressure of the steam from a stage by means of a compressor (see Figure 8.9). The condensation temperature is thus increased and the steam can be used to provide energy to the same stage it came from or to other stages (Mustacchi and Cena, 1978). As in a conventional MEB system, the vapor produced in the first effect is used as the heat input to the second effect, which is at a lower pressure. The vapor produced in the last effect is then passed to the vapor compressor, where it is compressed and its saturation temperature is raised before it is returned to the first effect. The compressor represents the major energy input to the system, and since the latent heat is effectively recycled around the plant, the process has the potential for delivering high PR values (Morris and Hanbury, 1991).
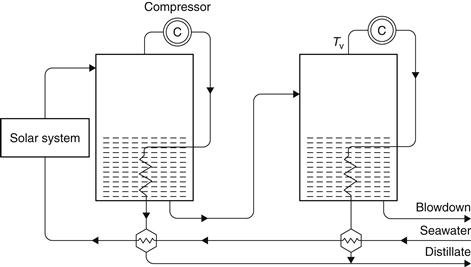
FIGURE 8.9 Principle of operation of a vapor compression (VC) system.
Parametric cost estimates and process designs have been carried out and show that this type of plant is not particularly convenient, unless it is combined with an MEB system. Furthermore, it appears that the mechanical energy requirements have to be provided with a primary drive, such as a diesel engine, and cooling the radiator of such an engine provides more than enough heat for the thermal requirements of the process, making the solar collector system redundant (Eggers-Lura, 1979). Therefore, the VC system can be used in conjunction with an MEB system and operated at periods of low solar radiation or overnight.
Vapor compression systems are subdivided in two main categories: mechanical vapor compressor (MVC) and thermal vapor compressor (TVC) systems. MVC systems employ a mechanical compressor to compress the vapor, whereas thermal ones utilize a steam jet compressor. The main problems associated with the MVC process are (Morris and Hanbury, 1991):
1. Vapor-containing brine is carried over into the compressor and leads to corrosion of the compressor blades.
2. There are plant-size limitations because of limited compressor capacities.
Thermal vapor systems are designed for projects where steam is available. The required pressure is between 2 and 10 bar, and due to the relatively high cost of the steam, a large number of evaporative condenser heat recovery effects are normally justified.
The total thermal load per unit of distillate is simply the latent heat of vaporization and the heating of the feed all through the range Tv − To, given by (El-Sayed and Silver, 1980):
![]() (8.60)
(8.60)
Tv = temperature of vapor entering the compressor as shown in Figure 8.9 (K).
To = environmental temperature (K).
The analysis of the MVC is also given by Al-Sahali and Ettouney (2007). The work done by the vapor compressor of efficiency η and compressibility factor γ is given by:
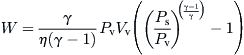 (8.61)
Vv = specific volume of vapor (m3/kg)
The evaporator mass and salt balance gives:
![]() (8.62a)
(8.62a)
![]() (8.62b)
(8.62b)
The energy balance of the evaporator actually equates the sensible heat for heating the feed and the latent heat for distillate evaporation with the latent heat of condensation of the compressed vapor and the sensible heat of superheating:
![]() (8.63)
(8.63)
Finally, the evaporator heat transfer area is given in terms of the sensible and latent heat of the condensing vapor:
![]() (8.64)
(8.64)
A thermal performance and exergy analysis of a TVC system is presented by Hamed et al. (1996), who reached the following conclusions:
1. Operational data of a four-effect low-temperature TVC desalination plant revealed that PRs of 6.5–6.8 can be attained. Such ratios are almost twice those of a conventional four-effect boiling desalination plant.
2. The PRs of the TVC system increase with the number of effects and the entrainment ratio of the thermo-compressor and decrease with the top brine temperature.
3. Exergy analysis reveals that the TVC desalination plant is the most exergy efficient when compared with the MVC and multiple-effect boiling (MEB) ones.
4. The subsystem most responsible for exergy destruction in all three desalination systems investigated is the first effect, because of the high temperature of its heat input. In the TVC system, this amounts to 39%, with the second highest exergy defect being that of the thermo-compressor, equal to 17%.
5. Exergy losses can be significantly reduced by increasing the number of effects and the thermo-compressor entrainment ratio (vapor taken from evaporator and compressed by ejector) or by decreasing the top brine and first-effect heat input temperatures.
8.4.4 Reverse osmosis
The reverse osmosis system (RO) depends on the properties of semi-permeable membranes, which, when used to separate water from a salt solution, allow freshwater to pass into the brine compartment under the influence of osmotic pressure. If a pressure in excess of this value is applied to the salty solution, freshwater will pass from the brine into the water compartment. Theoretically, the only energy requirement is to pump the feedwater at a pressure above the osmotic pressure. In practice, higher pressures must be used, typically 50–80 atm, to have a sufficient amount of water pass through a unit area of membrane (Dresner and Johnson, 1980). With reference to Figure 8.10, the feed is pressurized by a high-pressure pump and made to flow across the membrane surface. Part of this feed passes through the membrane, where the majority of the dissolved solids are removed. The remainder, together with the remaining salts, is rejected at high pressure. In larger plants, it is economically viable to recover the rejected brine energy with a suitable brine turbine. Such systems are called energy recovery reverse osmosis (ER-RO) systems.
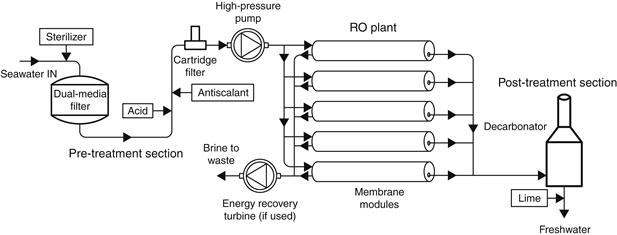
FIGURE 8.10 Principle of operation of a reverse osmosis (RO) system.
Solar energy can be used with RO systems as a prime mover source driving the pumps (Luft, 1982) or with the direct production of electricity through the use of photovoltaic panels (Grutcher, 1983). Wind energy can also be used as a prime mover source. Because the unit cost of the electricity produced from photovoltaic cells is high, photovoltaic-powered RO plants are equipped with energy recovery turbines. The output of RO systems is about 500–1500 l/day/m2 of membrane, depending on the amount of salts in the raw water and the condition of the membrane. The membranes are, in effect, very fine filters and very sensitive to both biological and non-biological fouling. To avoid fouling, careful pre-treatment of the feed is necessary before it is allowed to come in contact with the membrane surface.
One method used recently for the pre-treatment of seawater before directed to RO modules is nanofiltration (NF). NF was developed primarily as a membrane softening process, which offers an alternative to chemical softening. The main objectives of NF pre-treatment are (Adam et al., 2003):
1. Minimize particulate and microbial fouling of the RO membranes by removal of turbidity and bacteria.
2. Prevent scaling by removal of the hardness ions.
3. Lower the operating pressure of the RO process by reducing the feedwater TDS concentration.
The following model of the RO process is based on the two-parameter membrane model of Kimura and Sourirajan (1968) which is adapted according to membrane constructor practices as given by Vince et al. (2008). In the model the boron presence is not taken into account, the membrane is considered to be isothermal and the mass of salts in seawater is considered to be negligible in comparison with the mass of water, thus seawater density ρ is considered to be constant at 1000 kg/m3.
If Jw is the permeate mass flux through the membrane (kg/m2 s), Js is the salts mass flux through the membrane (kg/m2 s) and SM is the membrane active area in m2, then the membrane permeate mass flow rate (kg/s) is equal to:
![]() (8.65)
(8.65)
The mass balance of water and salts across the membrane gives:
![]() (8.66)
(8.66)
![]() (8.67)
(8.67)
where the subscripts f, p, and c are the feed, permeate, and concentrate water streams, respectively, all water mass flow rates is in kg/s, and the water stream salts mass concentration, C, is in kg of salts per kg of water.
The water recovery rate r is defined as the ratio of permeate to feed mass flow rate given by:
![]() (8.68)
(8.68)
The membrane salts rejection rate R is given by:
![]() (8.69)
(8.69)
The permeate mass flux Jw (kg/m2 s) through the membrane can be obtained by the Fick’s law:
![]() (8.70)
(8.70)
A = membrane permeability to pure water (kg/m2 s Pa).
ΔP = trans-membrane pressure (Pa).
Δπ = trans-membrane osmotic pressure (Pa).
Similarly, the salts mass flux Js (kg/m2 s) through the membrane is given by:
![]() (8.71)
(8.71)
B = membrane permeability to salts (kg/m2 s).
Cw = membrane wall mass salts concentration (kg of salts per kg of water).
The value in parenthesis in Eq. (8.71) is called the concentration polarization factor.
The assumption is made that the mass flux of solute through the membrane (kg/m2 s) is equal to the mass flux of permeate multiplied by the permeate mass salts concentration:
![]() (8.72)
(8.72)
The concentration polarization factor can be evaluated using the correlation developed by Taylor et al. (1994) and approximated for spiral-wound membranes by DOW (2006):
![]() (8.73)
(8.73)
Cc = the concentrate mass salts concentration (kg of salts per kg of water).
r = the water recovery rate of the membrane, given by Eq. (8.68).
The trans-membrane pressure ΔP (Pa) is calculated with:
![]() (8.74)
(8.74)
Pf = the applied feed pressure (Pa).
Pp = the resulting permeate pressure (Pa).
Δpdrop = the pressure drop along the membrane channel (Pa).
The pressure drop Δpdrop is approximated by the correlation defined by Schock and Miquel (1987) and adapted for spiral-wound membranes by DOW (2006):
![]() (8.75)
(8.75)
where the constants are: α = 1.7 and λ = 9.5 × 10⁸.
Considering that seawater contains only NaCl salts, the transmembrane osmotic pressure (Pa) is approximated by the Van’t Hoff relation:
![]() (8.76)
(8.76)
R = the universal gas constant (8.3145 J/mol K).
T = the water temperature (K).
MNaCl = the molar mass of NaCl (0.0585 kg/mol).
The membrane water permeability A is approximated as a function of feedwater temperature T, trans-membrane osmotic pressure Δp and fouling factor FF given by:
![]() (8.77)
(8.77)
Aref(Δπ) = the reference permeability at To = 298 K without fouling (kg/m2 s Pa).
TCF = the temperature correction factor at T.
FF = the fouling factor which expresses the influence of membrane fouling on membrane permeability and varies between 100% for new membranes and 80% for 4-year-old membranes (DOW, 2006).
The temperature correction factor TCF, which expresses the influence of temperature on membrane permeability is obtained using Arrhenius-type correlation (Mehdizadeh et al., 1989):
![]() (8.78)
(8.78)
where, T is the water temperature (K), To is the reference water temperature (298 K) and e is the membrane activation energy (J/mol), estimated for all RO membranes at 25,000 J/mol when K ≤ 298 K and at 22,000 J/mol when T > 298 K (DOW, 2006).
Usually, the influence of the osmotic pressure Δπ on the reference pure water permeability Aref(Δπ) is measured experimentally by membrane manufacturers at To = 298 K and FF = 1. As in most cases this relation is not given Aref(Δπ) is considered to be constant and equal to Aref. The membrane permeability to salts B is also considered to be constant (Kimura and Sourirajan, 1968).
Usually a number of membrane elements n are installed in the same pressure vessel (PV) which is equivalent to having n membranes in series. Therefore, the PV permeate is a mixture of the n membrane module permeates and the PV recovery rate is defined by (Vince et al., 2008):
![]() (8.79)
(8.79)
with rk the water recovery rate of the membrane k for k = 1 … n.
The pressure vessel is modeled as n successive membranes defined by Eqs (8.65)–(8.78).
For k = 2 … n, the concentrate flow rate, salinity, and pressure of membrane k − 1 are, respectively, the feedwater flow rate, salinity, and pressure of membrane k as given by:
![]() (8.80)
(8.80)
![]() (8.81)
(8.81)
Tabor (1990) analyzed a system using an RO desalination unit driven by photovoltaic (PV) panels or from a solar thermal plant. He concluded that, due to the high cost of the solar equipment, the cost of freshwater is about the same as with an RO system operated from the main power supply.
Cerci (2002) performed an exergy analysis of a 7250 m3/day RO desalination plant in California. The analysis of the system was conducted using actual plant operation data. The RO plant is described in detail, and the exergies across the major components of the plant are calculated and illustrated using exergy flow diagrams in an attempt to assess the exergy destruction distribution. He found that the primary locations of exergy destruction were the membrane modules in which the saline water is separated into the brine and the permeate and the throttling valves where the pressure of liquid is reduced, pressure drops through various process components, and the mixing chamber where the permeate and blend are mixed. The largest exergy destruction occurred in the membrane modules, and this amounted to 74.1% of the total exergy input. The smallest exergy destruction occurred in the mixing chamber. The mixing accounted for 0.67% of the total exergy input and presents a relatively small fraction. The second law efficiency of the plant was calculated to be 4.3%, which seems to be low. He shows that the second law efficiency can be increased to 4.9% by introducing a pressure exchanger with two throttling valves on the brine stream; this saved 19.8 kW of electricity by reducing the pumping power of the incoming saline water.
8.4.5 Electrodialysis
The electrodialysis (ED) system, shown schematically in Figure 8.11, works by reducing salinity by transferring ions from the feedwater compartment, through membranes, under the influence of an electrical potential difference. The process utilizes a DC electric field to remove salt ions in the brackish water. Saline feedwater contains dissolved salts separated into positively charged sodium and negatively charged chlorine ions. These ions move toward an oppositively charged electrode immersed in the solution, that is, positive ions (cations) go to the negative electrode (cathode) and negative ions (anions) to the positive electrode (anode). If special membranes, alternatively cation permeable and anion permeable, separate the electrodes, the center gap between these membranes is depleted of salts (Shaffer and Mintz, 1980). In an actual process, a large number of alternating cation and anion membranes are stacked together, separated by plastic flow spacers that allow the passage of water. The streams of alternating flow spacers are a sequence of diluted and concentrated water, which flow parallel to each other. To prevent scaling, inverters are used that reverse the polarity of the electric field approximately every 20 minutes.
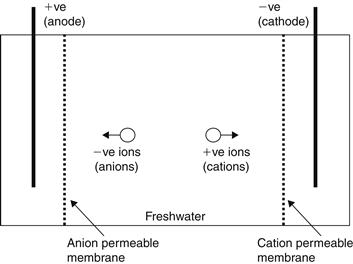
FIGURE 8.11 Principle of operation of electrodialysis (ED).
Because the energy requirements of the system are proportional to the water’s salinity, ED is more feasible when the salinity of the feedwater is no more than about 6000 ppm of dissolved solids. Similarly, due to the low conductivity, which increases the energy requirements of very pure water, the process is not suitable for water of less than about 400 ppm of dissolved solids.
Because the process operates with DC power, solar energy can be used with ED by directly producing the voltage difference required with photovoltaic panels.
Leave a Reply