
The operation of solar collectors and systems depends on the solar radiation input and the ambient air temperature and their sequences. One of the forms in which solar radiation data are available is on maps. These give the general impression of the availability of solar radiation without details on the local meteorological conditions and, for this reason, must be used with care. One valuable source of such information is the Meteonorm. Two maps showing the annual mean global solar radiation for the years 1981–2000 for Europe and North America are shown in Figures 2.32 and 2.33, respectively (Meteonorm, 2009). These are based on numerous climatological databases and computational models. Maps for other regions of the world can be obtained from the Meteonorm web site (Meteonorm, 2009).
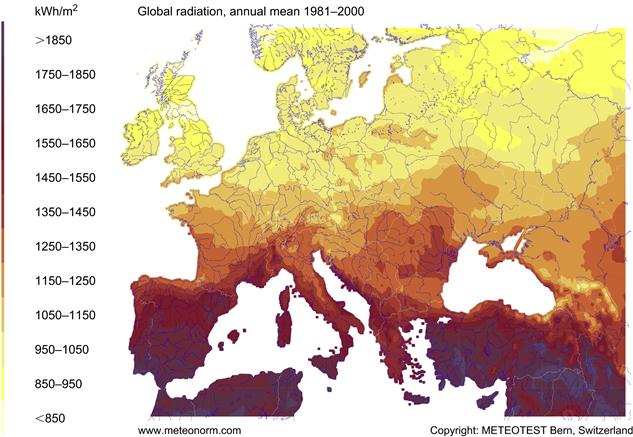
FIGURE 2.32 Annual total solar irradiation on horizontal surface for Europe. Source: Meteonorm database of Meteotest (www.Meteonorm.com).
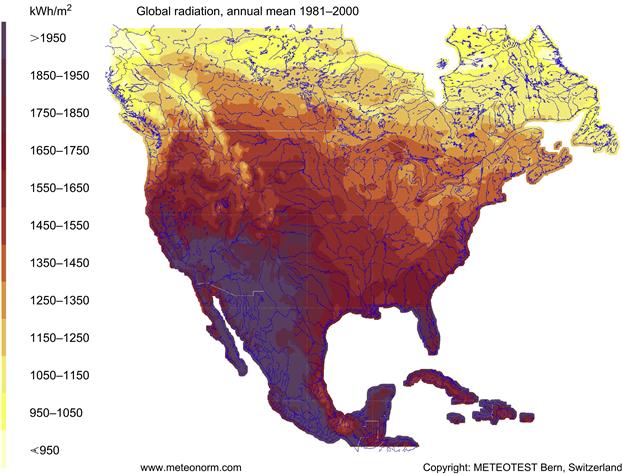
FIGURE 2.33 Annual total solar irradiation on horizontal surface for North America. Source: Meteonorm database of Meteotest (www.Meteonorm.com).
Another way of estimating the average solar radiation ![]() is by the use of the following equation (Page, 1964):
is by the use of the following equation (Page, 1964):
![]() (2.110)
(2.110)
![]() = monthly average daily hours of sunshine
= monthly average daily hours of sunshine
![]() = monthly average maximum possible daily hours of sunshine, given by the day length (Eq. (2.17)) of the average day of each month shown in Table 2.1.
= monthly average maximum possible daily hours of sunshine, given by the day length (Eq. (2.17)) of the average day of each month shown in Table 2.1.
As was seen before values of ![]() can be obtained from Eq. (2.79) and for the average day of each month values can be obtained directly from Table 2.5. The constants a and b can be obtained from published tables or can be estimated from measured data in a location.
can be obtained from Eq. (2.79) and for the average day of each month values can be obtained directly from Table 2.5. The constants a and b can be obtained from published tables or can be estimated from measured data in a location.
For the local climate, data in the form of a TMY are usually required. This is a typical year, which is defined as a year that sums up all the climatic information characterizing a period as long as the mean life of a solar system. In this way, the long-term performance of a collector or a system can be calculated by running a computer program over the reference year.
2.4.1 Typical meteorological year
A representative database of weather data for 1-year duration is known as the test reference year (TRY) or typical meteorological year (TMY). A TMY is a data set of hourly values of solar radiation and meteorological elements. It consists of months selected from individual years concatenated to form a complete year. The TMY contains values of solar radiation (global on horizontal and direct), ambient temperature, relative humidity, and wind speed and direction for all hours of the year. The selection of typical weather conditions for a given location is very crucial in computer simulations to predict the performance of solar systems and the thermal performance of buildings and has led various investigators to either run long periods of observational data or select a particular year that appears to be typical from several years of data. The intended use of a TMY file is for computer simulations of solar energy conversion systems and building systems (see Chapter 11, Section 11.5).
The adequacy of using an average or typical year of meteorological data with a simulation model to provide an estimate of the long-term system performance depends on the sensitivity of system performance to the hourly and daily weather sequences. Regardless of how it is selected, an “average” year cannot be expected to have the same weather sequences as those occurring over the long term. However, the simulated performance of a system for an “average year” may provide a good estimate of the long-term system performance, if the weather sequences occurring in the average year are representative of those occurring over the long term or the system performance is independent of the weather sequences (Klein et al., 1976). Using this approach, the long-term integrated system performance can be evaluated and the dynamic system’s behavior can be obtained.
In the past, many attempts were made to generate such climatological databases for different areas around the world using various methodologies. One of the most common methodologies for generating a TMY is the one proposed by Hall et al. (1978) using the Filkenstein–Schafer (FS) statistical method (Filkenstein and Schafer, 1971).
The FS method algorithm is as follows: First, the cumulative distribution functions (CDFs) are calculated for each selected meteorological parameter and for each month, over the whole selected period as well as over each specific year of the period. To calculate the CDFs for each parameter, the data are grouped in a number of bins, and the CDFs are calculated by counting the cases in the same bin.
The next step is to compare the CDF of a meteorological parameter, such as global horizontal radiation, for each month for each specific year with the respective CDF of the long-term composite of all years in the selected period.
The FS is the mean difference of the long-term CDF, CDFLT, and the specific month’s CDF, CDFSM, calculated in the bins used for the estimation of the CDFs, given by:
![]() (2.111)
(2.111)
N = number of bins (by default, N = 31).
zi = value of the FS statistic for the particular month of the specific year and the meteorological parameter under consideration.
The next step is the application of the weighting factors, WFj, to the FS statistics values, one for each of the considered meteorological parameters, FSj, corresponding to each specific month in the selected period. In this way, a weighted sum, or average value, WS, is derived and this value is assigned to the respective month; that is,
![]() (2.112)
(2.112)
with
![]() (2.113)
(2.113)
M = number of parameters in the database.
The user can change the WF values, thus examining the relative importance of each meteorological parameter in the final result. The smaller the WS, the better the approximation to a typical meteorological month (TMM).
Applying this procedure for all months of the available period, a composite year can be formed consisting of the selected months with the smallest WS values.
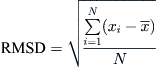
The root mean standard deviation (RMSD) of the total daily values of the global solar irradiance distribution for each month of each year can then be estimated with respect to the mean long-term hourly distribution and the FS statistics. The RMSD can be computed, and for each month, the year corresponding to the lowest value can be selected. The estimations are carried out according to the expression:
 (2.114)
where ![]() = the average value of its parameter over the number of bins (N = 31).
= the average value of its parameter over the number of bins (N = 31).
A total of 8760 rows are included in a TMY file, each corresponding to an hour of the year. The format of TMY file suitable for earlier versions of the TRNSYS program is shown in Table 2.6.
Table 2.6
Format of TMY File Suitable for the TRNSYS Program Up to Version 14
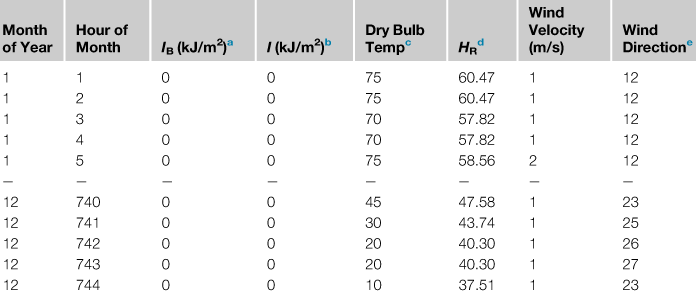
aIB = Direct (beam) normal solar radiation (integrated over previous hour) in kJ/m2.
bI = Global solar radiation on horizontal (integrated over previous hour) in kJ/m2.
dHumidity ratio (HR) in kg of water/kg of air ×°10,000.
eDegrees ÷ 10, expressed as 0 for wind from north, 9 for east, 18 for south, and so forth.
2.4.2 Typical meteorological year, second generation
A type 2 TMY format is completely different and consists of many more fields. Such a file can be used with detailed building analysis programs such as TRNSYS (version 16), DOE-2, BDA (Building Design Advisor), and Energy Plus. A TMY-2 file also contains a complete year (8760 items of data) of hourly meteorological data. Each hourly record in the file contains values for solar radiation, dry bulb temperature, and meteorological elements, such as illuminance, precipitation, visibility, and snowfall. Radiation and illumination data are becoming increasingly necessary in many simulation programs. A two-character source and an uncertainty flag are attached to each data value to indicate whether the data value was measured, modeled, or missing and provide an estimate of the uncertainty of the data value. By including the uncertainty flags, users can evaluate the potential impact of weather variability on the performance of solar systems or buildings.
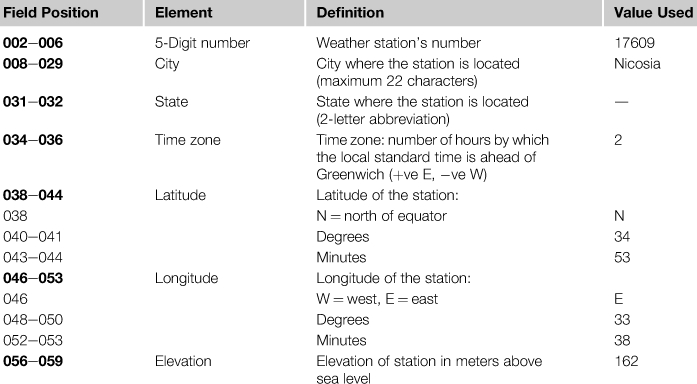
The first record of each file is the file header that describes the station. The file header contains a five-digit meteorological station number, city, state (optional), time zone, latitude, longitude, and elevation. The field positions and definitions of these header elements, together with the values given for the TMY2 for Nicosia, Cyprus (Kalogirou, 2003), are shown in Table 2.7.
Table 2.7
Header Elements in the TMY-2 Format (First Record Only)
Following the file header, 8760 hourly data records provide a 1-year record of solar radiation, illuminance, and meteorological data, along with their source and uncertainty flags. Table 2.8 gives field positions and element definitions of each hourly record (Marion and Urban, 1995). Each hourly record begins with the year (field positions 2–3) from which the typical month was chosen, followed by the month, day, and hour information and the rest of the data as shown in Table 2.8 (Kalogirou, 2003).
Table 2.8
Data Elements in the TMY-2 Format (All Except the First Record)
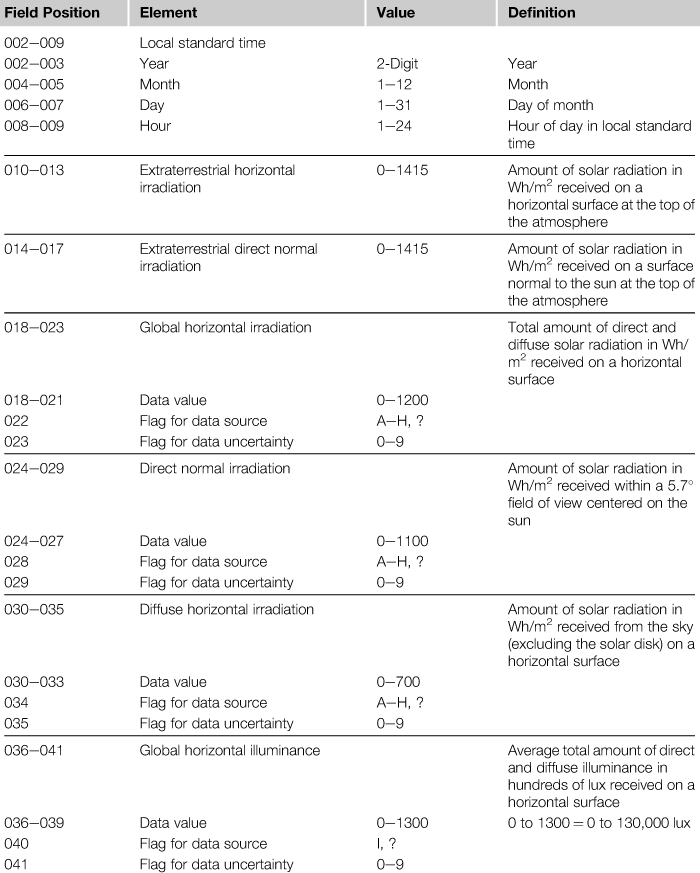
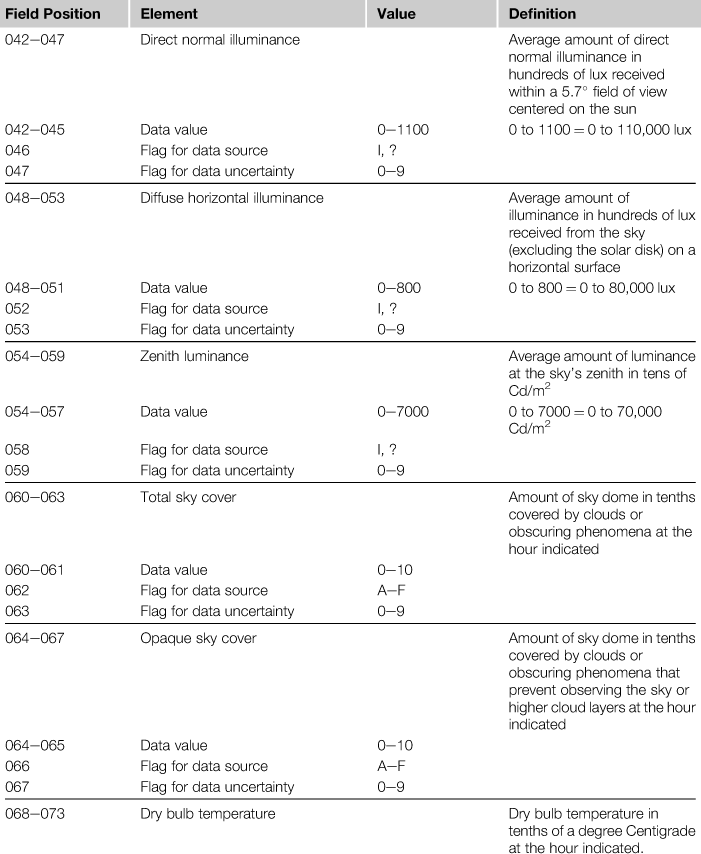
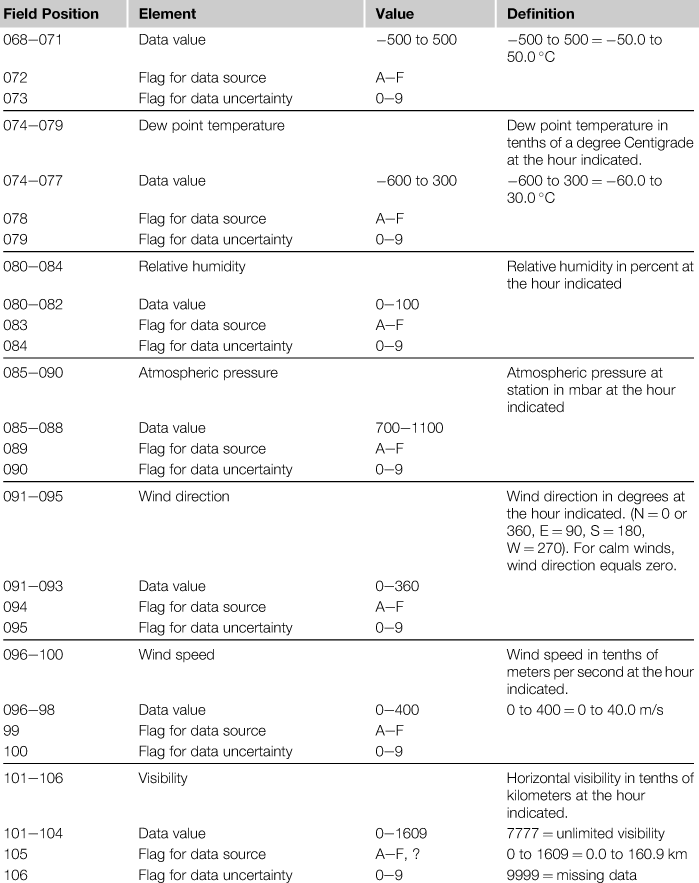
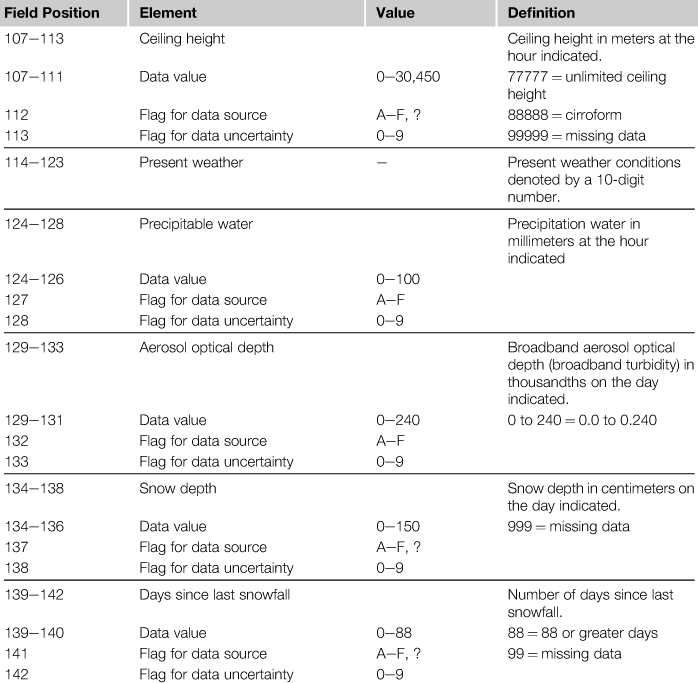
From Marion and Urban (1995).
For solar radiation and illuminance elements, the data values represent the energy received during the 60 min preceding the hour indicated. For meteorological elements (with a few exceptions), observations or measurements were made at the hour indicated. A few of the meteorological elements have observations, measurements, or estimates made at daily, instead of hourly, intervals. Consequently, the data values for broadband aerosol optical depth, snow depth, and days since last snowfall represent the values available for the day indicated.
With the exception of extraterrestrial horizontal and extraterrestrial direct radiation, the two field positions immediately following the data value provide source and uncertainty flags both to indicate whether the data were measured, modeled, or missing and to provide an estimate of the uncertainty of the data. Source and uncertainty flags for extraterrestrial horizontal and extraterrestrial direct radiation are not provided, because these elements were calculated using equations considered to give exact values. Explanation of the uncertainty flags for the other quantities is given in Marion and Urban (1995).
A sample of the Nicosia TMY-2 file, showing the data for the first days of January, including the header elements, can be seen in Figure 2.34 (Kalogirou, 2003). It should be noted that the format of the TMY-2 for the Energy Plus program is a little different than the one shown in Figure 2.34 since it includes after the header design conditions, extreme periods and holidays, and daylight saving data.
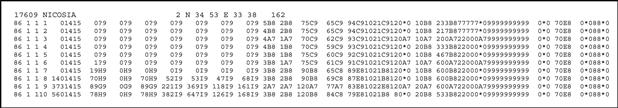
FIGURE 2.34 Format of TMY-2 file.
2.4.3 Typical meteorological year, third generation
The changes between TMY-2 and TMY-3 concern the format of the file and minor changes to the algorithm in selecting typical months. The latter concern changes to the persistence criteria implemented, which better accommodates the selection a TMM for periods or records with fewer years. Additionally, the code which prioritized the selection of months with measured solar data was removed. The effects of these changes between the TMY-2 and TMY-3 algorithm were evaluated as part of the TMY-3 production process (Wilcox and Marion, 2008). In particular, a few changes from the TMY-2 procedures were required to accommodate the use of data derived from only a 15-year period. For TMY-2 data, months with measured solar radiation data were preferred for selection as a typical month. TMY-3 procedures do not include this criterion because only modeled solar radiation data are included in the TMY-3 data to provide more consistent solar radiation values. For the TMY-3 data, using only 15 years instead of 30 years to select a candidate month, require that the persistence checks are relaxed to ensure that a candidate month could be selected. For the TMY-2 data, a candidate month is excluded from further consideration if it is the month with the most runs. For TMY-3, a candidate month is only excluded if it has more runs than every other candidate month. Consequently, if two candidate months tie for the most runs, neither is removed by the TMY-3 procedure, whereas the TMY-2 procedure would get rid of both candidate months. As an additional step, if the TMY-3 persistence procedure eliminates all candidate months, persistence was ignored and a month was selected from the candidate months that was closest to the long-term mean and median. This ensured the selection of a typical month for TMY-3 using 15-year or shorter data sets. No TMY for a site was produced however, if the pool of data was less than 10 years (Wilcox and Marion, 2008).
Generally, except for a few changes to the weighting criteria, which account for the relative importance of the solar radiation and meteorological elements, the TMY-2 and TMY-3 data sets were created using procedures similar to those developed by Sandia National Laboratories (Hall et al., 1978). The format for the TMY-3 data however is radically different from that of the TMY and TMY-2. The older TMY formats used columnar or positional layouts to optimize the data storage space. Such formats though are difficult to read, and also it is difficult to import specific data fields into many software packages. Therefore the comma-separated value (CSV) format is adopted in TMY-3 which is ubiquitous, and many existing programs and applications provide built-in functions to read or parse it. For compatibility with existing software, the National Renewable Energy Laboratory (NREL) has produced an application to convert from TMY-3 to TMY-2 format. Despite the format differences however, the fields in the TMY-3 are very similar to those in the TMY-2 data set. Fundamental differences are measurement units, which are SI or equivalent in the TMY-3, the addition of new fields for surface albedo and liquid precipitation, and the removal of the fields for present weather, snow depth, and days since last snowfall that were present in the TMY-2 (Wilcox and Marion, 2008). These fields were removed because of incompatible changes in the nature of the source data or because the source data were not available for many stations. The TMY-3 data format has two header lines and 8760 lines of data, each with 68 data fields. The header line 1 contains the same data as the ones shown in Table 2.7 with the difference that the “city” is replaced by the “station name”, whereas header line 2 contains data field name and units. The field format of the rest of the lines is similar to the TMY-2 format shown in Table 2.8 except for the local standard time data fields at the beginning which are changed to “Date” in MM/DD/YYYY format and “Time” in HH:MM format and the other changes at the end of the data fields as noted above.
The volcanic eruptions of El Chichón in Mexico in March 1982 and Mount Pinatubo in the Philippines in June 1991 injected large amounts of aerosols into the stratosphere. The aerosols spread northward and circulated around the earth. This phenomenon noticeably decreased the amount of solar radiation reaching the earth during May 1982 until December 1984 due to El Chichón and from June 1991 to December 1994 due to Pinatubo, after which the effects of the aerosols diminished. Consequently, these months were not used in any of the TMY procedures because they were considered as non-typical (Wilcox and Marion, 2008). The TMY-3 data files for many US locations are available for download from the NREL web site (NREL, 2012).
Leave a Reply